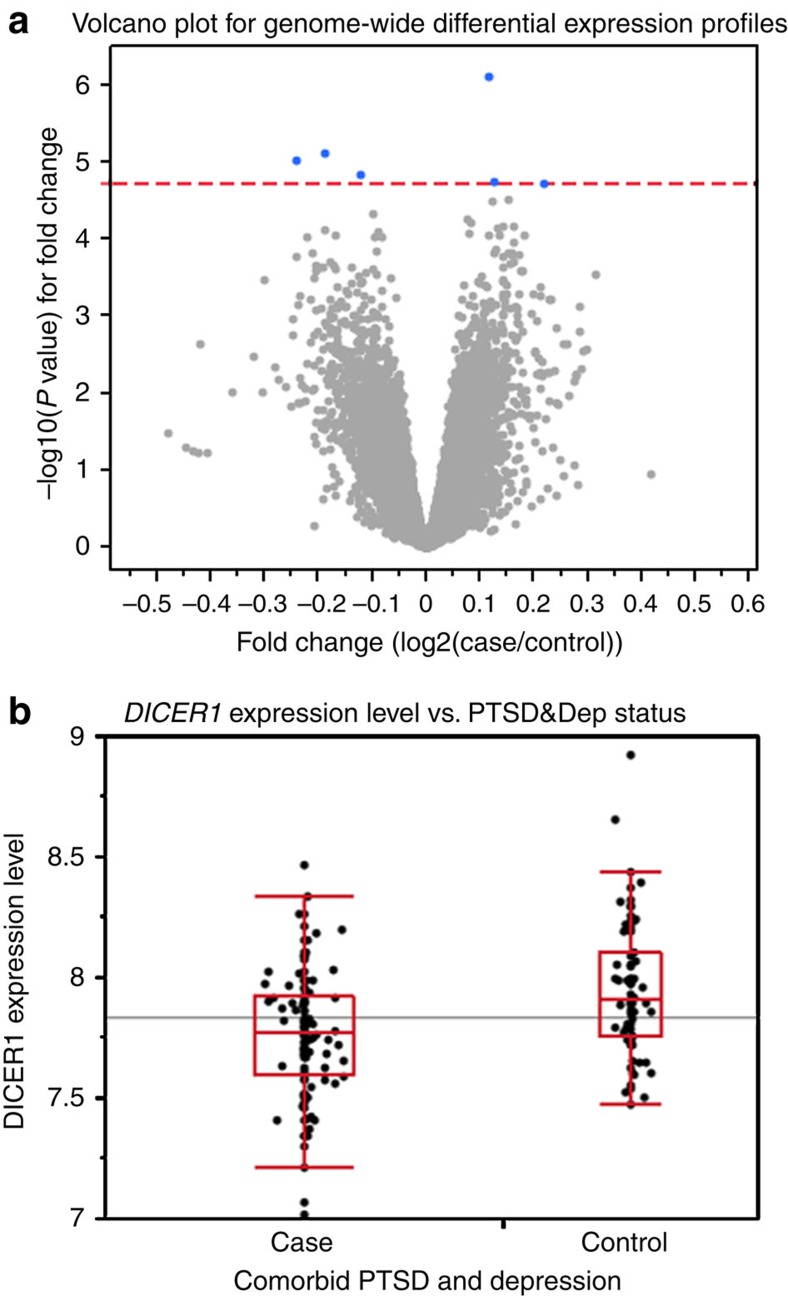
Figure 1. Genome-wide differential gene expression profiles in PTSD&Dep cases vs controls.
(a) Volcano plot for genome-wide differential gene expression profiles between cases of PTSD&Dep and controls, adjusting for sex, age and population substructure. The red line represents P value at FDR of 0.05 (−log10p=4.729). The blue dots represent genes significantly differentially expressed between cases and controls. These genes are MRPS23, DICER1, CHST15, ZXDC, PDCD5 and LOC649548. Cases had reduced DICER1 expression compared with controls. (b) Box plot for DICER1 expression level in cases of PTSD&Dep and controls. The horizontal line represents the mean DICER1 level in the overall sample. These were derived from expression microarrays.

