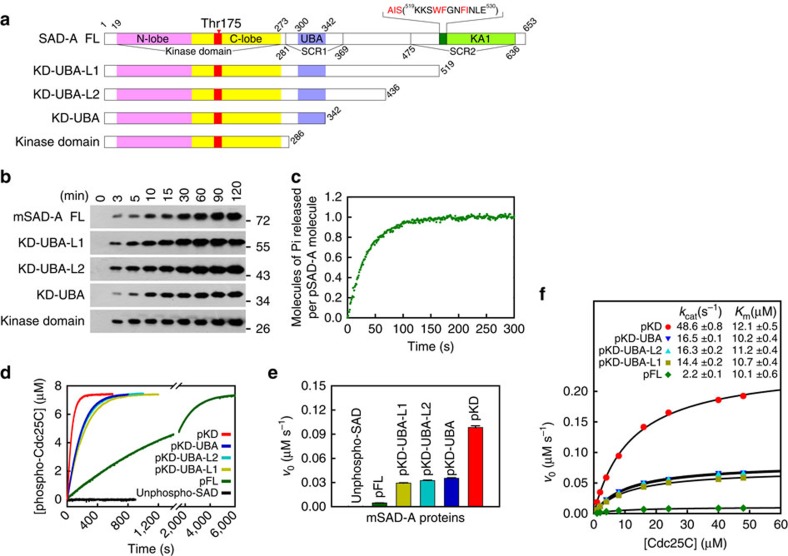
Figure 1. Two elements within the non-catalytic region autoinhibit SAD-A activity.
(a) Schematic diagram of mouse SAD-A. The structural elements are coloured as follows: the kinase domain (N-lobe, pink; C-lobe, yellow; activation segment, red), UBA (slate blue), AIS (dark green) and KA1 (green). The sequence of AIS is provided, with the key residues highlighted in red. (b) Phosphorylation of SAD-A Thr175 by LKB1 analyzed using an anti-AMPK-pT172 antibody. (c) Representative time course of PP2Cα-catalyzed dephosphorylation of activated SAD. The reaction mixture contains 1 μM SAD-A full-length protein and 250 nM PP2Cα. (d) Time courses of SAD-catalyzed phosphorylation of Cdc25C. Reactions were initiated by adding 5 nM indicated SAD-A protein to the reaction mixture containing 7.5 μM Cdc25C peptide. (e) Comparison of the initial rates of 5 nM various SAD-A fragments towards 7.5 μM Cdc25C peptide (mean±s.e.m., n=3). (f) Plots of initial rate of SAD-catalyzed Cdc25C phosphorylation versus the Cdc25C concentration. The solid lines represent the best fitting results to the Michaelis–Menten equation with kcat and Km values listed at the top.

