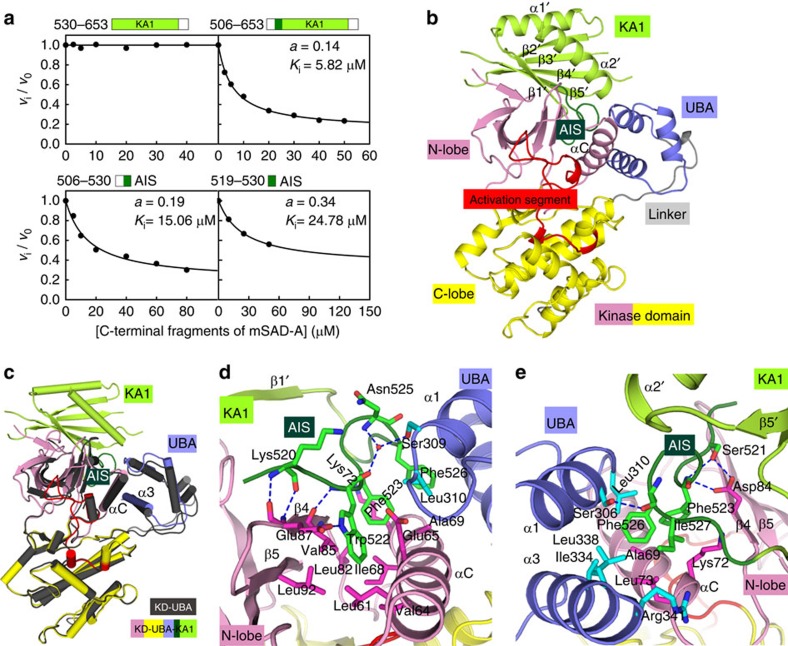
Figure 4. AIS binds at the KD-UBA junction and inhibits SAD-A activity.
(a) Trans-inhibition of different C-terminal fragments on the activity of KD-UBA (10 nM). The continuous curves were the best-fit to the non-competitive model using equation vi/v0=(Ki+a[I])/(Ki+[I]), where Ki and a are the apparent inhibition constant and residual activity, respectively. (b) Overall structure of the KD-UBA and AIS-KA1 complex. The color scheme for the complex follows that in Fig. 1a. (c) Comparison of the KD-UBA conformations in complex with AIS-KA1 and in isolation. The KD-UBA alone is shown in dark grey. (d,e) Close-up views of AIS binding to the KD-UBA junction. The interacting residues in the AIS sequence are highlighted as green sticks, and those from the kinase and UBA domains are shown as magenta and cyan sticks, respectively.

