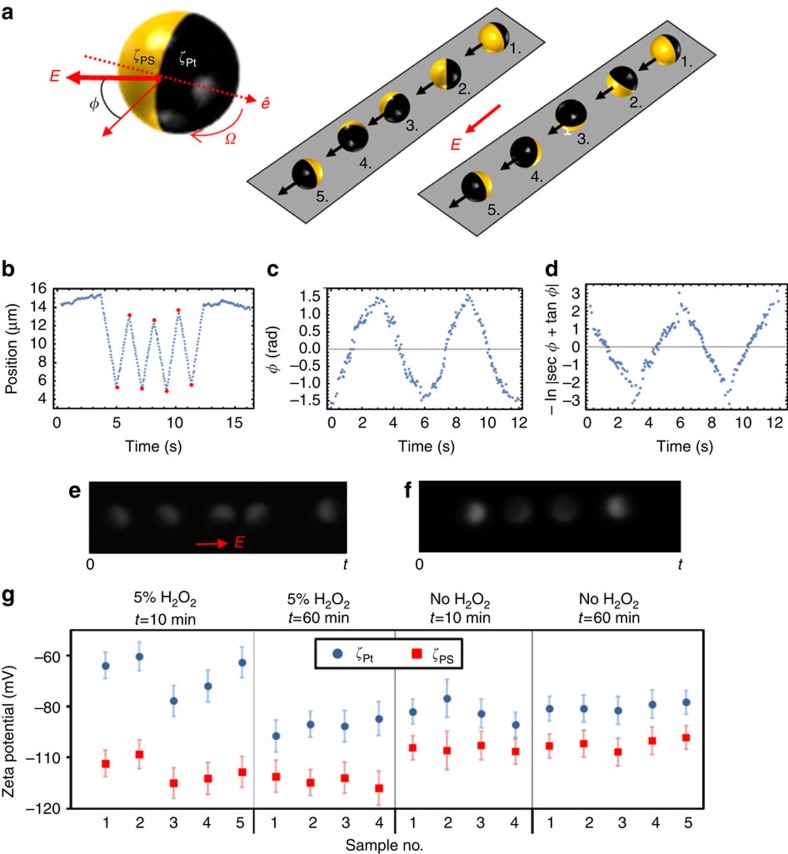
Figure 3. Electrophoretic behaviour for Janus colloids.
(a) Schematic representation of the rotational electrophoresis experiment. Left hand side shows the relevant physical quantities, a Janus sphere with hemispheres with two different zeta potentials (ζPt and ζPS), giving a dipole vector  . The dipole vector rotates in an electric field, and the right hand side 3D schematics depict the effect of switching the direction of E. Stage 1 represents the initial misaligned dipole and applied field orientation immediately after the E-field direction is switched, stages 2–5 show two possible rotations to re-align the dipole with the applied field: on the left hand side about an out-of-plane axis, with constant polar angle, θ, and on the right about an axis parallel to the plane where polar angle changes; at position 5
  reaches the steady state. The black arrows show the direction of translational motion, which is always aligned with the applied field (see b). (b) Typical position versus time curves obtained by tracking a Janus particle (a=2.4 μm) above a glass interface with E∞=2.5 V cm−1 in 1 mM NaCl. E∞ pointed in the negative × direction first and then switched every second. The red circles are times when E∞ changed directions. (c) Typical φ versus time curve for rotation of a Janus colloid (2.5 V cm−1, 5% H2O2, 1 mM NaCl). We changed the direction of E∞ after the particle aligned with the applied field. (d) f(φ) versus t for b from equation (7) (see Methods). e,f show still frames from a fluorescence microscopy video for a Pt–PS Janus particle rotating about an out-of-plane axis (e) and about an axis parallel to the plane (f) from the point at which the applied E-field polarity was reversed to the depicted direction (red arrow). (g) Measured zeta potentials for both Pt (blue markers) and PS (red markers) at two time points following sample preparation, each with and without hydrogen peroxide. Error bars represent the zeta potential s.d. determined from at least four field reversals.

