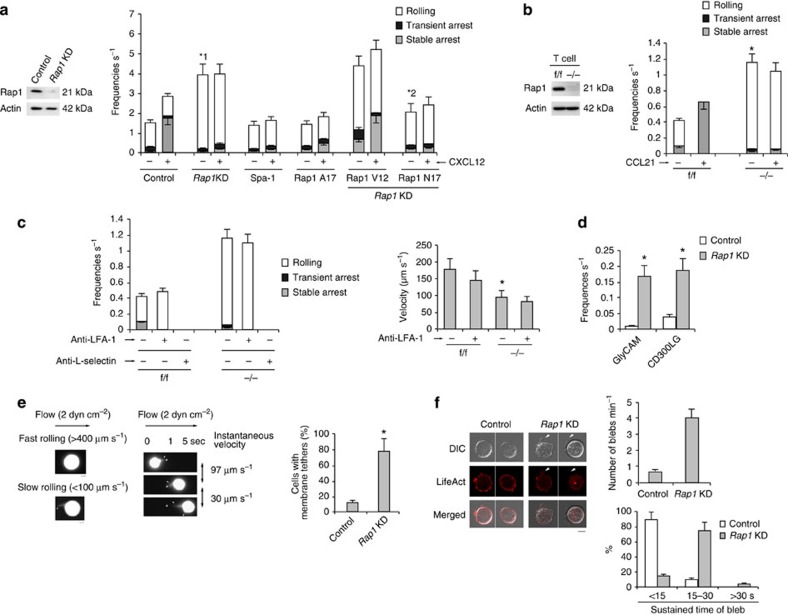
Figure 1. Rap1 deficiency enhances L-selectin-dependent rolling.
(a; Left) Total lysates from BAF/LFA-1/L-selectin cells transduced with scramble (Control) or Rap1a or b (Rap1KD)-targeting short hairpin RNA (shRNA) were immunoblotted with anti-Rap1. Actin is a loading control. (Right) Control, Rap1KD, Spa-1or Rap1A17-expressing cells or Rap1KD cells transfected with Rap1V12 or Rap1N17 were perfused on LS12 monolayers immobilized ±100 nM CXCL12. Adhesive events of more than 100 cells were measured. *1P<0.001, *2P<0.006, relative to the total frequency of control cells or Rap1KD cells. (b; Left) Total lysates from Rap1a, bf/f or Rap1a, b−/− T cells were immunoblotted with anti-Rap1. Actin is a loading control. (Right) Adhesion of f/f or −/− T cells to LS12 cells expressing mouse ICAM-1 ±100 nM CCL21 was measured (n=100 of each group). *P<0.001 versus total frequency of f/f T cells. (c; Left) Effects of anti-LFA-1 or L-selectin on the interaction frequencies of f/f or −/− T cells on LS12 cells in the absence of CCL21. (Right) Rolling velocities of f/f or −/− T cells pre-treated ± anti–LFA-1 in the absence of CCL21 (n=100 of each group). *P<0.003 versus f/f cells. (d) Control or Rap1KD cells were perfused on plates immobilized with purified GlyCAM-1 or CD300LG (n=50 of each group). *1P<0.001 versus control cells. (e; Left) Morphology of rolling cells on the endothelium. A representative control cell exhibiting fast rolling and a Rap1KD cell exhibiting slow rolling are shown. Scale bars, 5 μm. (Centre) Sequential images of slow-rolling Rap1KD cell at the indicated times. Scale bars, 5 μm. Arrows show tethers. (Right) Ratios of cells exhibiting membrane tethers (n=50 cells of each group). *P<0.001 versus control cells. (f; Left) Confocal microscopic analysis of control or Rap1KD cells, transfected with LifeAct-mCherry. Scale bar, 5 μm. Arrows show blebs. (Right) Percentages of the cells showing number of blebs per minute (upper) and sustained bleb times (lower) in control or Rap1KD cells (n=50 of each group) are shown. All data show the means±s.e.m. or representative of three independent experiments.

