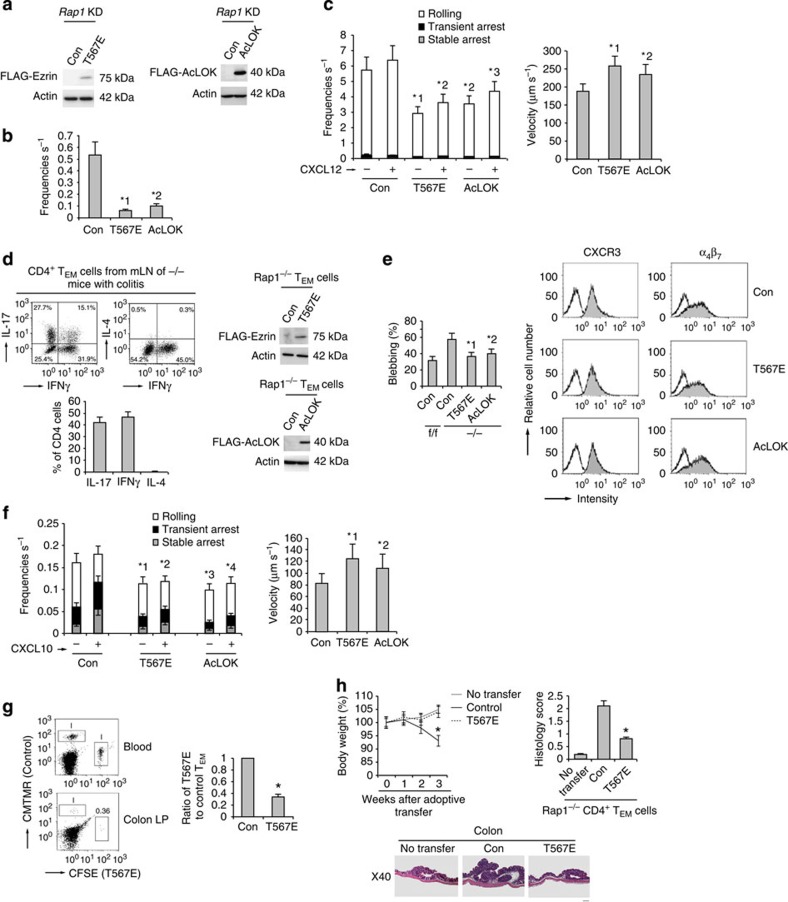
Figure 6. Phosphomimetic ezrin or AcLOK inhibits T-cell rolling.
(a) Western blots with anti-FLAG of total cell lysates from Rap1KD cells with control, FLAG-Ezrin mutant (T567E; left) or FLAG-AcLOK (right)-encoding lentivirus. Actin is a loading control. (b) Adhesion of control, T567E or AcLOK-expressing Rap1KD cells to purified CD300LG under shear flow. *1P<0.001, *2P<0.001 versus control Rap1KD cells. (c; Left) Adhesion of control, T567E or AcLOK-expressing Rap1KD cells to the endothelium under shear flow. *1P<0.001, *2P<0.003, *3P<0.002 versus frequencies of the corresponding control Rap1KD cells. (Right) Rolling velocities without CXCL12 (n=150). *1P<0.01, *2P<0.02 versus control Rap1KD cells. (d; Left upper) Cytokine profiles of CD4+ TEM cells from mLNs of −/− mice with colitis (n=5). (Left lower) Percentages of IL-17, IFNγ or IL-4-producing cells. (Right) Western blots with anti-FLAG of total cell lysates from −/− CD4+ TEM cells introduced with T567E or AcLOK. Actin is a loading control. (e; Left) Percentages of f/f or control, T567E or AcLOK-expressing −/− TEM cells blebbing more than once per minute (n=50). *1P<0.001, *2P<0.002 versus control −/− TEM cells. (Right) Expression profiles of CXCR3 and α4β7 in those cells. (f; Left) Control, T567E or AcLOK-expressing −/− TEM cells perfused on the MadCAM-1 ± CXCL10. Over 100 cells were measured. *1P<0.005, *2P<0.01, *3P<0.004, *4P<0.01 versus frequencies of the corresponding control −/− TEM cells. (Right) Their rolling velocity without CXCL10. *1P<0.005, *2P<0.01 versus control TEM cells. (g; Left) Analysis of cells from the colon LP of mice that received control or T567E-expressing −/− TEM cells. Numbers indicate the ratios of T567E-expressing to control cells. (Right) Ratios of T567E-expressing to control cells are shown (n=3 experiments). *P<0.001 versus control −/− TEM cells. (h; Upper left) Body weight of the recipient mice receiving control or T567E-expressing −/− CD4+ TEM cells (n=3 per group) were presented as percentage of original body weight. *P<0.02 versus untransferred mice. (Upper right) Colitis-induced damage in the recipient mice. *P<0.001 versus control −/− TEM cells. (Lower) Colon histology in recipient mice. Scale bars, 200 μm. All data show the means±s.e.m. or representative of three independent experiments.

