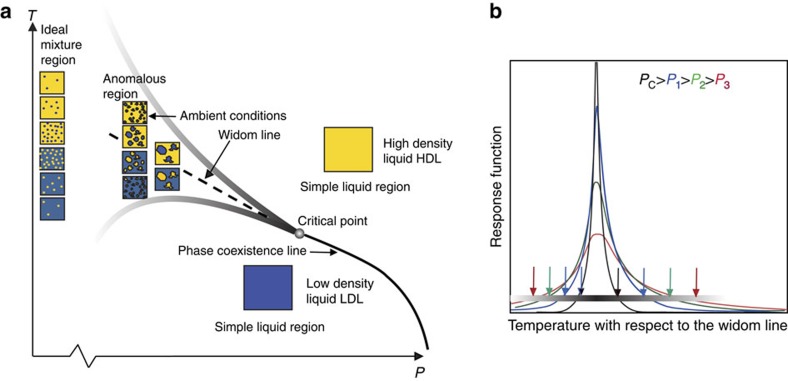
Figure 5. Unified picture.
(a) Schematic picture of a hypothetical phase diagram of liquid water showing the liquid–liquid coexistence line between LDL and HDL in terms of simple liquid regions, the critical point (real or virtual), the Widom line in the one-phase region and fluctuations on different length scales emanating from the critical point giving rise to local spatially separated regions in the anomalous region. The shaded lines indicate how far in temperature the fluctuations extend at the various pressures defining the anomalous region. (b) Schematic diagram of the temperature dependence with respect to the Widom line of a thermodynamic response function, such as the isothermal compressibility (κT) or heat capacity (CP), at various pressures but below the pressure of a critical point. Entering into the anomalous region (shaded line in a) can be defined as the temperature when the absolute value of the slope has increased beyond some pre-defined value indicated by arrows.

