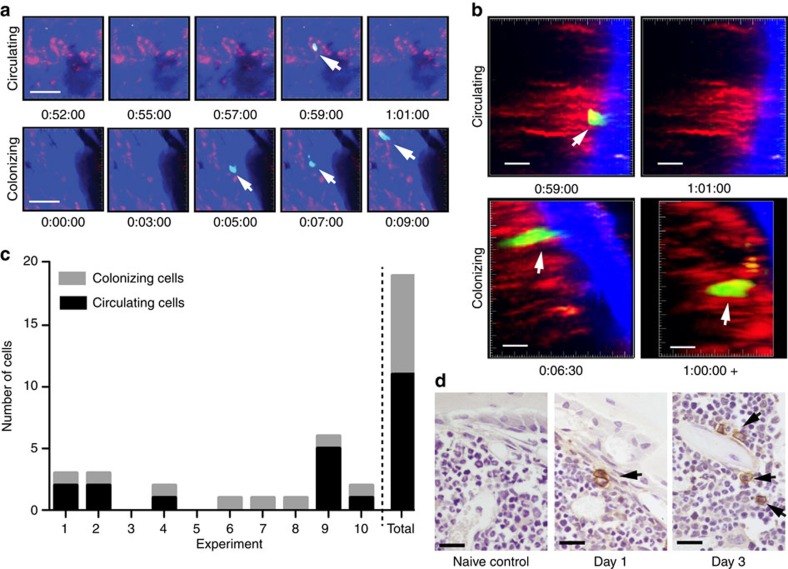
Figure 1. Intravital two-photon microscopy of cancer cells colonizing bone.
(a) Still-frames capturing the arrival of a circulating tumour cell (top panels) and colonizing tumour cell (bottom panels) in real time. Blue, bone; red, vasculature; green, 5TGM1-GFP myeloma cells. Scale bars, 50 μm. It corresponds to Supplementary Movies 1 and 2. (b) Still-frames of the same cells in a showing egress of circulating cell from bone after 2 min and retention of a colonizing cell >1 h in the bone. Blue, bone; red, vasculature; green, 5TGM1-GFP myeloma cells. Scale bars, 20 μm. (c) Proportion of cells that circulated through or colonized the bone marrow in each experiment and total of all experiments. (d) CD138-stained sections from naive, or cell-injected mice at 1 and 3 days post injection. Single CD138+ cells (brown, black arrows), haematoxylin counterstain. Scale bars, 20 μm. Data represent at least three experiments.

