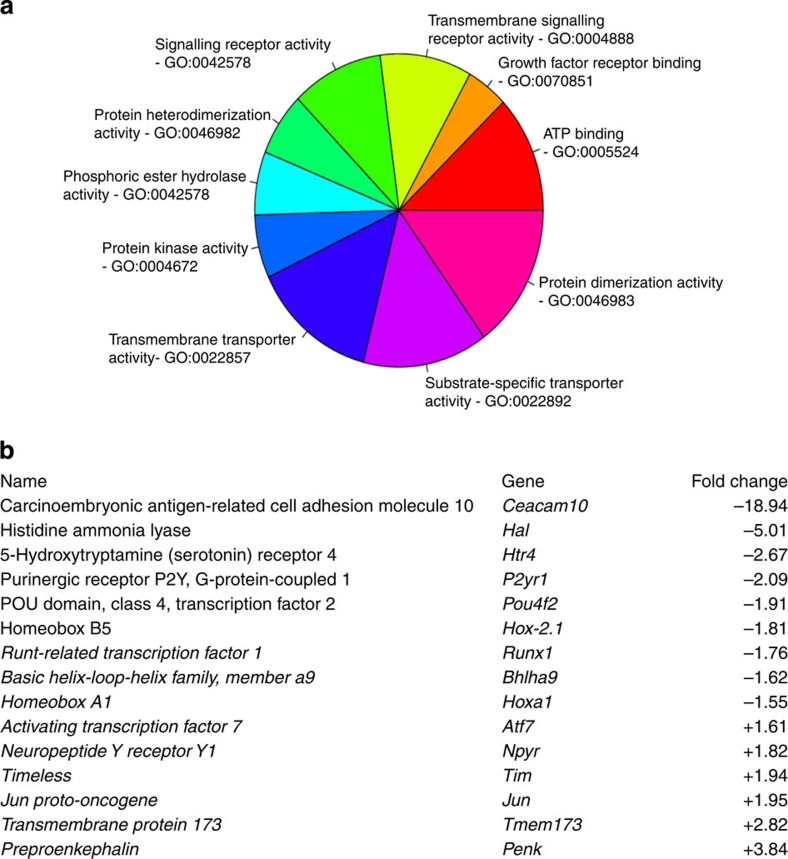
Figure 1. Deletion of Nav1.7 leads to altered gene expression in DRG neurons.
(a) The pie chart shows the number of significantly differentially expressed (DE) genes (analysis of variance P-value<0.01) between Nav1.7 KO mice (n=3) and wild-type littermates (n=3), annotated with the top enriched Gene Ontology (GO) terms regarding the Biological Process (BP). For the enrichments analysis, we used methods based both on gene counts, namely the classical Fisher test, and gene ranks and scores, namely the Kolmogorov–Smirnov-type tests. (b) Example list of the fold change of differentially expressed genes in sensory neurons from Nav1.7 KO mice. Complete data are available at GEO and ArrayExpress, accession code GSE61373.

