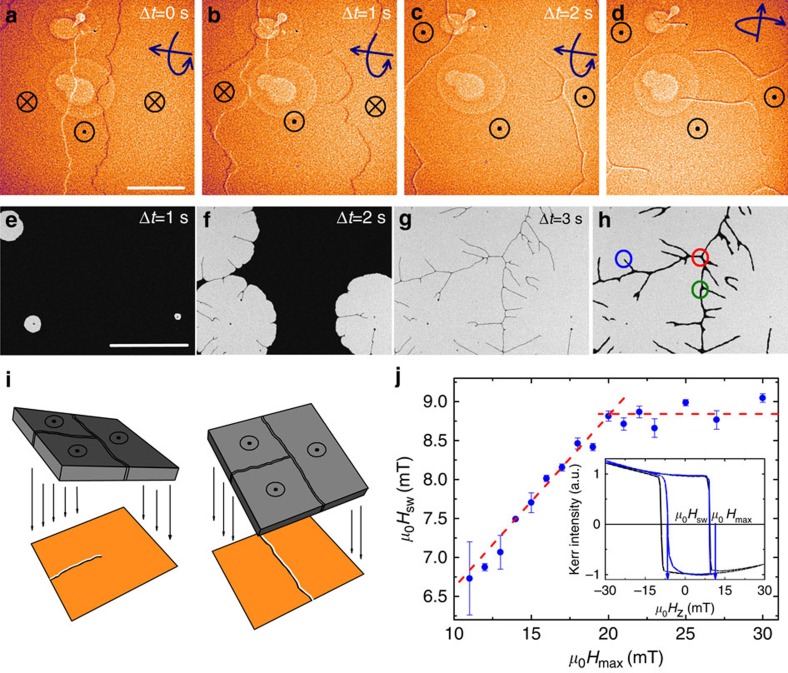
Figure 3. Field-driven DW displacement experiments.
(a–c) L-TEM images of the DWs displaced by external field of μ0Hext=2 mT as a function of time. Symbols denote orientation of the magnetization. Scale bar, 20 μm. (d) The character of the Néel walls is confirmed by tilting the sample as indicated by the arrows. (e–g) Polar Kerr microscopy images showing the magnetization reversal process, with topologically protected 360° DW structures indicated by the black lines between domains at 7 mT (g). Therefore they behave as artificial nucleation centres when the polarity of the external magnetic field is reversed in h. Here the free end of the DW loop is marked with a blue circle, whilst the triple points are marked with green and red circles. (i) The contrast from two perpendicular DWs can be revealed by tilting the sample with the respect to the DW orientation. Scale bar, 100 μm. (j) Switching field μ0Hsw as a function of μ0Hmax where the dashed lines correspond to the two linear regimes. Inset shows hysteresis loop cycled between ±30 mT (black) and +30 mT and μ0Hmax (blue). A total of, 10 hysteresis loops were averaged to determine μ0Hsw.

