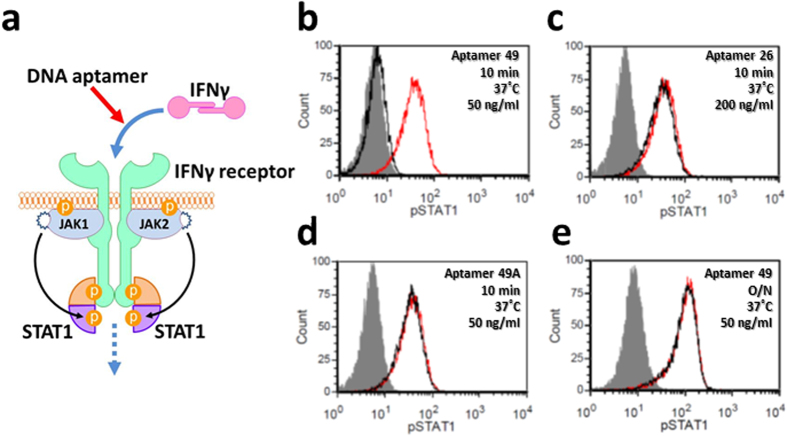
Figure 2. Inhibition of the interaction between IFNγ and its receptor by anti-IFNγ DNA aptamers.
(a) Schematic illustration of the inhibition of the IFNγ-induced cellular signalling pathway by an anti-IFNγ DNA aptamer. (b–e) FACS analysis of STAT1 phosphorylation in the presence of each aptamer. Black and red peaks represent 2 ng/ml of human IFNγ treatment with and without aptamers (b) 50 ng/ml of aptamer 49 for 10 min, (c) 200 ng/ml of aptamer 26 for 10 min, (d) 50 ng/ml of aptamer 49A for 10 min, (e) 50 ng/ml of aptamer 49 overnight), respectively. Grey peaks represent unstimulated cells.

