FIGURE 3.
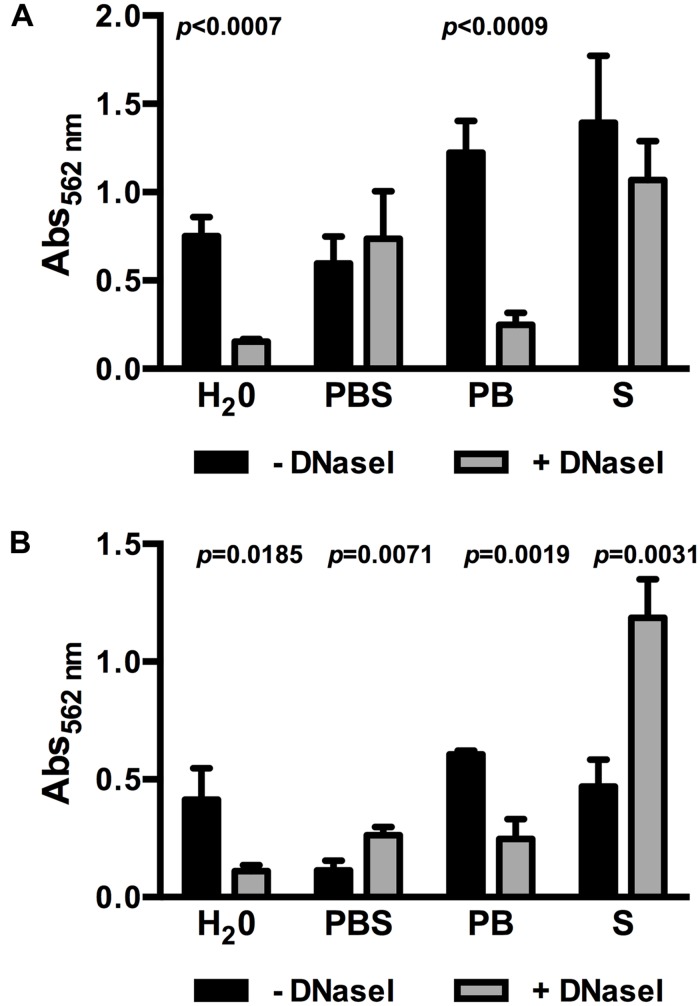
Biofilm formation of Lm EGD-e grown in 0.1BHI prepared with either dH2O, PBS, phosphate buffer (PB), or saline (S) grown at 25°C (A) or 37°C (B) in the presence (gray bars) or absence (black bars) of DNaseI. Values are absorbance at 562 nm and are mean ± standard deviation of three independent experiments. Data was analyzed using Student’s t-test and p-values of statistically significant differences are indicated (all other comparisons: not significant, i.e., p > 0.05).

