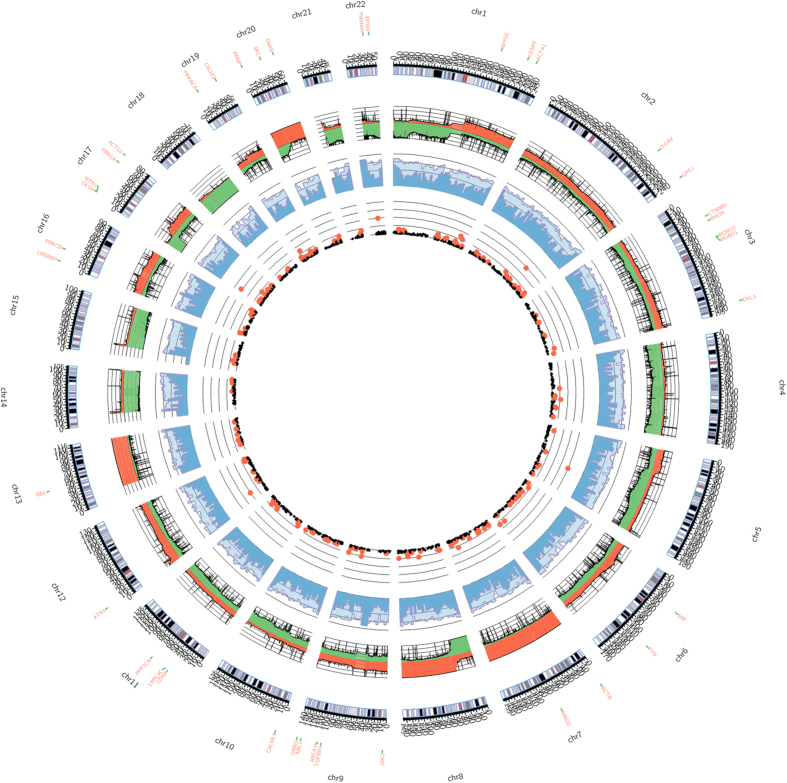
Figure 2. Circos plot in terms of DNA copy number, DNA methylation and somatic mutation.
An ideogram of a normal karyotype is shown in the outermost ring. The next outermost ring represents DNA copy number at corresponding genomic coordinates, calculated by the segment gain or loss (SGOL) scores (red represents amplification and green represents deletion). The next ring represents the amount of DNA methylation. The whole genome was segmented into contiguous 500,000 base pair (bp) bins, and the median (dark blue) and 75th percentile (light blue) of methylation levels of CpGs which could be mapped onto each bin were plotted. The innermost ring is scatter plot illustrating somatic mutation data, genes with mutation rate >5% were shown in black and those >10% were shown in red.

