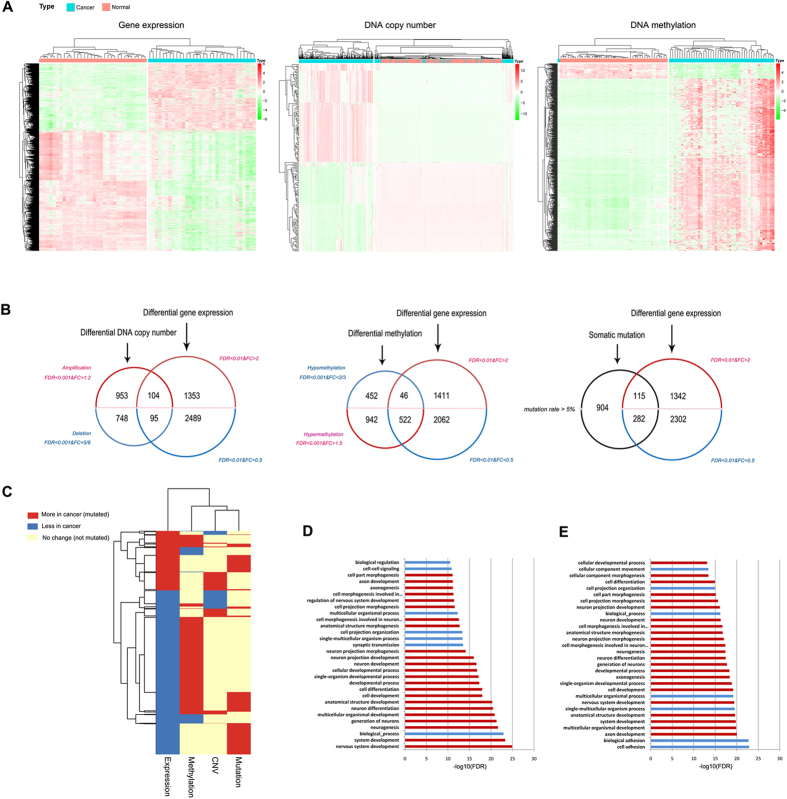
Figure 3. Identification of three gene groups with multi-omic data in the Cancer Genome Atlas (TCGA) database.
(a) Heat maps of differentially expressed genes (DEGs) [log2 transformed RNASeq by Expectation Maximization (RSEM) normalized read counts], DEGs with copy number variation (CNV), and DEGs with aberrant promoter methylation in corresponding paired TCGA data, respectively. (b) Venn diagram illustrating three groups of candidate genes with differential expression and another altered molecular level, such as DNA copy number, promoter methylation and somatic mutation. (c) Integrated genetic and epigenetic alteration patterns of differentially expressed genes. Rows represent DEGs, and columns represent four dysregulation types. Red denotes the more in cancer (overexpression, promoter hypermethylation or DNA amplification) or mutated DEGs. Blue denotes less in cancer (underexpression, promoter hypomethylation or DNA deletion) or not mutated DEGs. (d) Gene ontology (GO) enrichment analysis of Group B genes [differentially expressed genes (DEGs) with abnormal promoter methylation]. Red bar represents enriched GO terms which are offspring of developmental process. (e) GO enrichment analysis of Group C genes (DEGs with somatic mutation).

