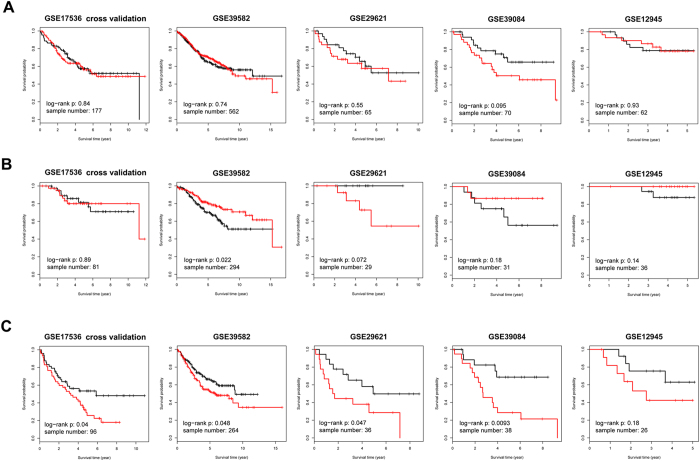
Figure 5. Kaplan–Meier survival analysis of random-walk significant genes in five independent datasets of Clinicinfo.
(a) Kaplan–Meier survival analysis of 37 significant genes with all-stage samples in five independent data sets of Clinicinfo superset. GSE17536 was treated as training cohort, and five-fold cross validation was conducted to calculate risk score. Survival analysis was performed to discriminate OS between risk score assigned groups. (b) Kaplan–Meier survival analysis of 37 significant genes in five independent data sets with Stage I/II samples. (c) Kaplan–Meier survival analysis of 37 significant genes in five independent data sets with Stage III/IV samples. Note: in Kaplan–Meier survival analysis, red curve represents the subgroup with higher risk score, and black curve represents lower risk score.

