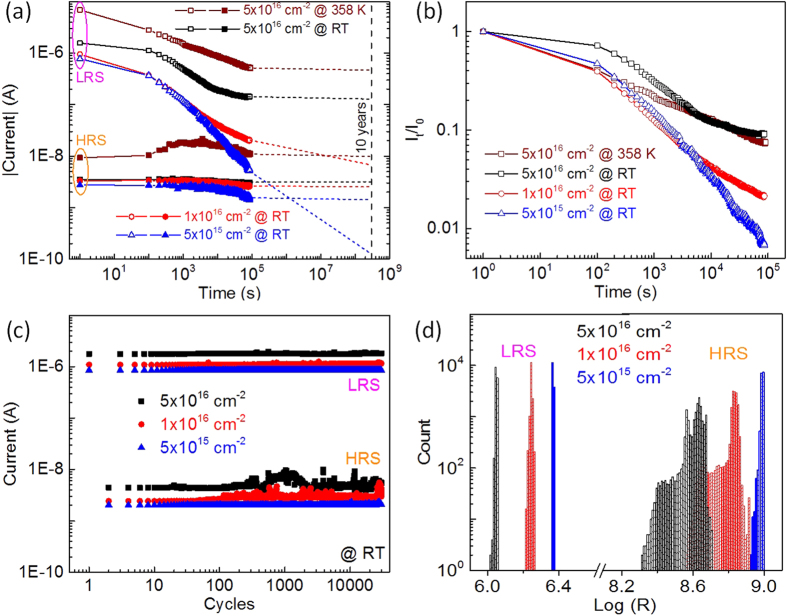
Figure 4.
(a) Retention test results of the MIM structures with different Ti fluences. The extrapolated 10-years HRS/LRS retention time can be expressed by the dashed lines. (b) Normalized current of LRS vs. retention time. The current values taken at different time (It) are normalized by the initially measured current value (I0). (c) Endurance test results of the MIM structures with different Ti fluences. (d) Statistics histograms of LRS/HRS in the endurance test results.

