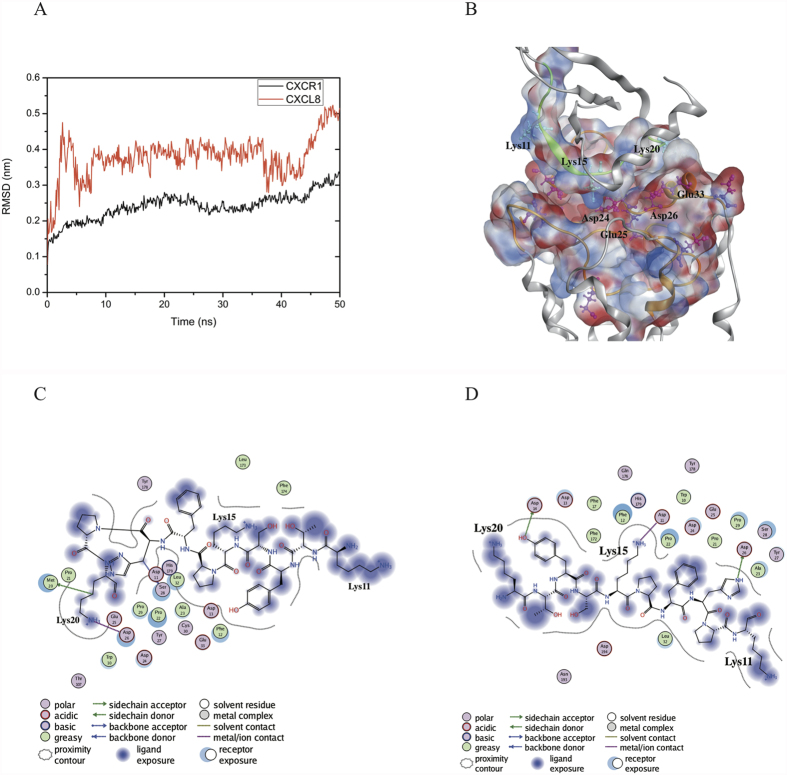
Figure 1. RMSD values and interaction maps of CXCL8 binding with CXCR1 during the initial MD simulations.
(A) RMSD values for the backbone atoms of CXCL8 and CXCR1 during the first 50 ns MD trajectory. (B) The surface charge distribution of the average complex structure over the last 30 ns of the MD trajectory based on Poisson-Boltzmann equation, in which blue color corresponds to positive and red color to negative electrostatic potential. (C) The interaction map of CXCL8 initial binding to CXCR1. The cationic end of K20 of CXCL8 forms salt bridges with E25 and D26 of CXCR1. (D) The interaction map of average structure of the complex over the last 30 ns of the MD trajectory. The cationic end of K15 of CXCL8 forms a salt bridge with D11 of CXCR1; Y13 and H18 of CXCL8 form H-bonds with D14 and D26 of CXCR1.

