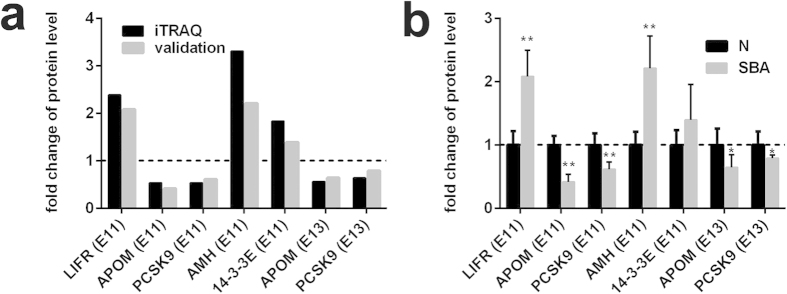
Figure 3. Expression patterns of selected protein candidates in the serum of the experimental group compared with the control group using iTRAQ analysis and ELISA validation.
(a) Fold change of protein levels (the mean value of experimental group / the mean value of control group) of LIFR (E11), AMH (E11), 14-3-3E (E11), APOM (E11 and E13), and PCSK9 (E11 and E13) from iTRAQ analysis and ELISA validation. (b) Fold change of protein levels (the protein concentration of each sample/the mean concentration of control group) of LIFR (E11), AMH (E11), 14-3-3E (E11), APOM (E11 and E13), and PCSK9 (E11 and E13) from ELISA analysis (n = 6). *p < 0.05, **p < 0.01 (pregnant rats with SBA serum vs. control serum). The data are shown as the mean value ± SD. The upregulated proteins in the experimental group were above the dotted line, and the downregulated were below the dotted line.

