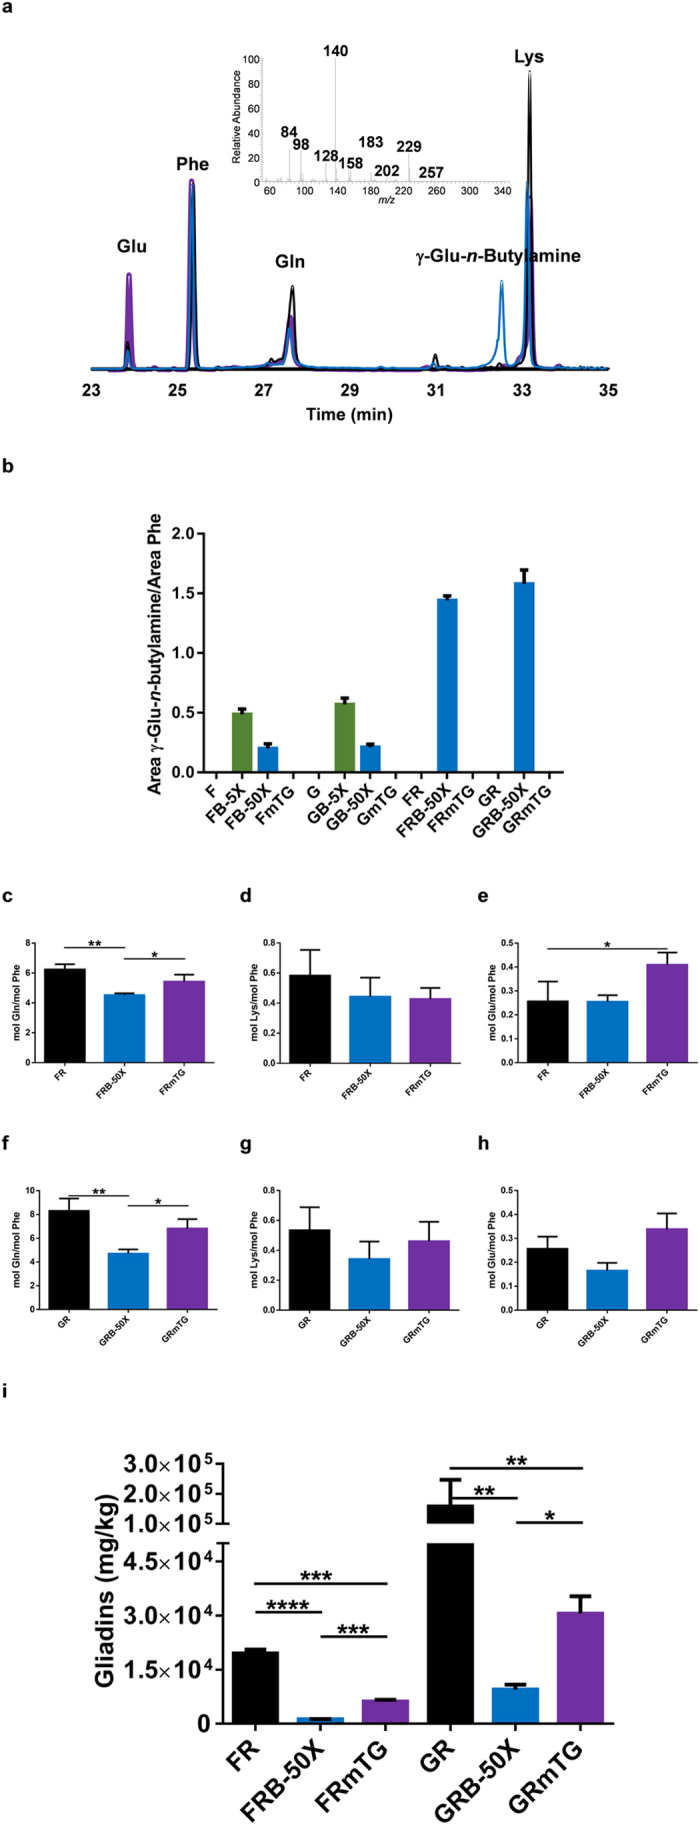
Figure 3. Reducing conditions favour the transamidation of gluten proteins and decreases further the amount of toxic epitopes.

(a) GC-MS chromatogram for the amino acid analysis of  FR,
FR,  FRB 50X and
  FRmTG. Indicated are the peaks of glutamic acid (Glu), phenylalanine (Phe), glutamine (Gln), γ-glutamyl-n-butylamine (γ-Glu-n-butylamine) and lysine (Lys). EI mass spectra of γ-Glu-n-butylamine residue is shown. (b) γ-Glu-n-butylamine residue formation under non-reducing and reducing conditions. For b, experiments were run in triplicate, and error bars represent the s.d. Amino acid composition determined after enzymatic hydrolysis of wheat flour (c–e) and gluten (f–h), original and derivatised with mTG alone and with n-butylamine as amine nucleophile under reducing conditions. For (c–h), error bars represent the standard deviation *p < 0.05, **p < 0.01, ***p < 0.001 and ****p < 0.0001 (n = 3). (i) R5 reactive epitopes’ content (mg of gliadin per kg of product) of wheat flour and gluten, original and derivatised with mTG alone and with n-butylamine as amine nucleophile under reducing conditions after peptic-tryptic digestion. n = 2 different experiments (each with four replicates) and error bars represent the s.d. *p < 0.05, **p < 0.01, ***p < 0.001 and ****p < 0.0001. For sample nomenclature please consult Fig. 6.
