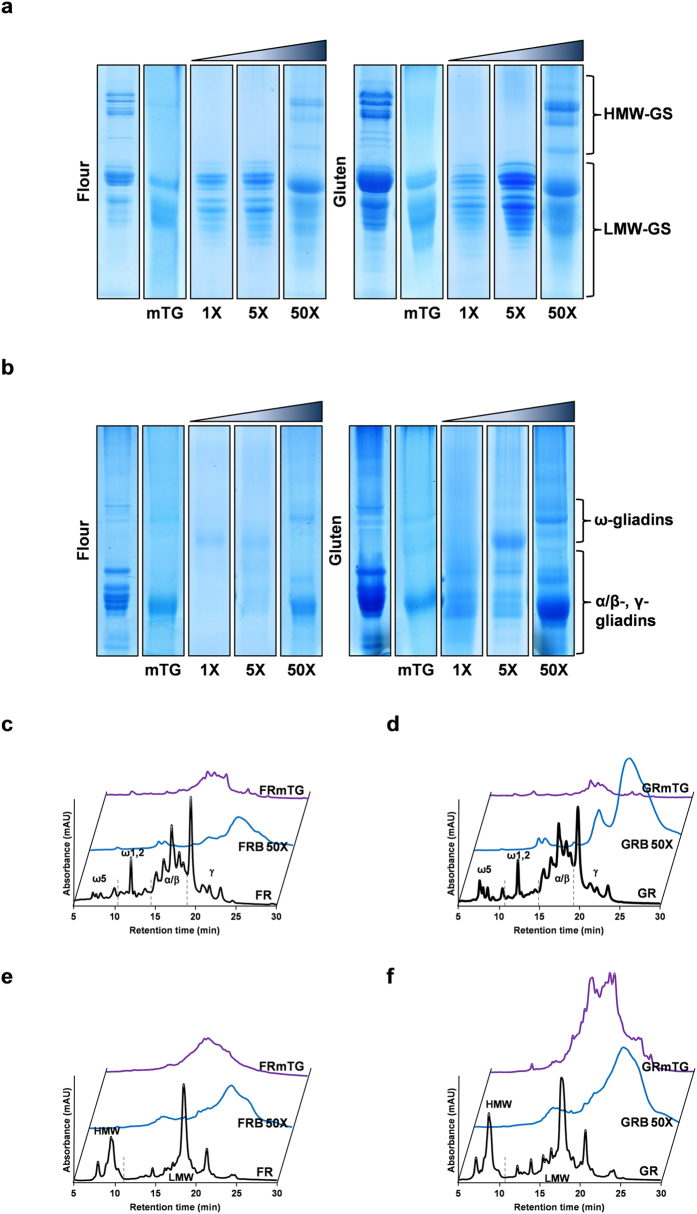
Figure 4. Structural changes in gluten proteins by transamidation of wheat flour and gluten under reducing conditions.
(a) Reduced and alkylated glutenin subunit electrophoretic patterns of wheat flour and gluten (as denoted), original and derivatised with mTG alone and with n-butylamine as amine nucleophile with increasing concentrations under reducing conditions. (b) Gliadin electrophoretic patterns of wheat flour and gluten (as denoted), original and derivatised with mTG alone and with n-butylamine as amine nucleophile with increasing concentrations under reducing conditions. Reversed-phase HPLC results for gliadins (c,d) and glutenins (e,f) extracts of wheat flour and gluten, original and derivatised with mTG alone and with n-butylamine as amine nucleophile under reducing conditions. Wheat flour chromatograms are represented for a maximum absorbance of 1.0 and gluten chromatograms are represented for a maximum absorbance of 2.5. ω5, ω1, 2, α/β and γ represent the different identified gliadin proteins, and HMW and LMW represent the different glutenin subunits. Absorbance was registered at 210 nm. For sample nomenclature please consult Fig. 6.

