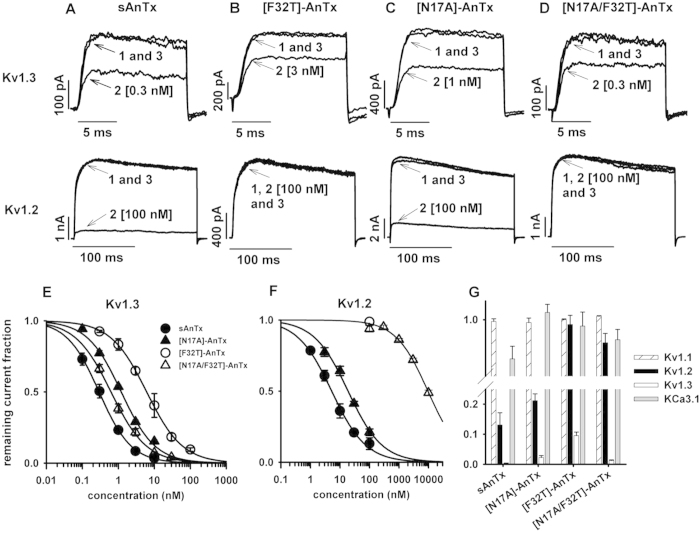
Figure 3. Selectivity profile of synthetic AnTx variants.
The effect of (A) sAnTx, (B) [F32T]-AnTx, (C) [N17A]-AnTx and (D) [N17A/F32T]-AnTx on Kv1.3 and Kv1.2 channels. Upper panels. Kv1.3 currents were measured in activated human lymphocytes. The bath was perfused continuously. The traces show the K+ current before the application of the toxin (1), after the equilibration of the block in the presence of the indicated concentration of the toxin (2) and after recovery from block during the perfusion of the bath with toxin-free solution (3). Lower panels. Whole-cell Kv1.2 currents were measured in a transfected CHO cells. Traces are labelled as in the upper panels. See text for voltage protocols. Concentration-dependence of K+ current block by sAnTx (filled circles), [F32T]-AnTx (empty circles), [N17A]-AnTx (filled triangles) and [N17A/F32T]-AnTx (empty triangles) on (E) Kv1.3 and (F) Kv1.2 channels. The superimposed solid lines are the Hill equations fitted to the data points (see Material and Methods). The best fits yielded (E) Kd = 0.2 nM, and H = 1.0 for sAnTx, Kd = 6.2 nM and H = 1 for [F32T]-AnTx, Kd = 1.2 nM and H = 0.9 for [N17A]-AnTx and Kd = 0.6 nM and H = 0.9 for [N17A/F32T]-AnTx, and (F) Kd = 5.2 nM, and H = 0.8 for sAnTx, Kd = 20.0 nM and H = 0.8 for [N17A]-AnTx and Kd = 9.6 μM and H = 0.8 for [N17A/F32T]-AnTx. (G) Effect of AnTx variants at 100 nM on Kv1.1. Kv1.2, Kv1.3 and KCa3.1 channels (for details see Materials and Methods). The bars show the average remaining current fraction of 3–5 independent measurements at +50 mV where the error bars represent the S.E.M.

