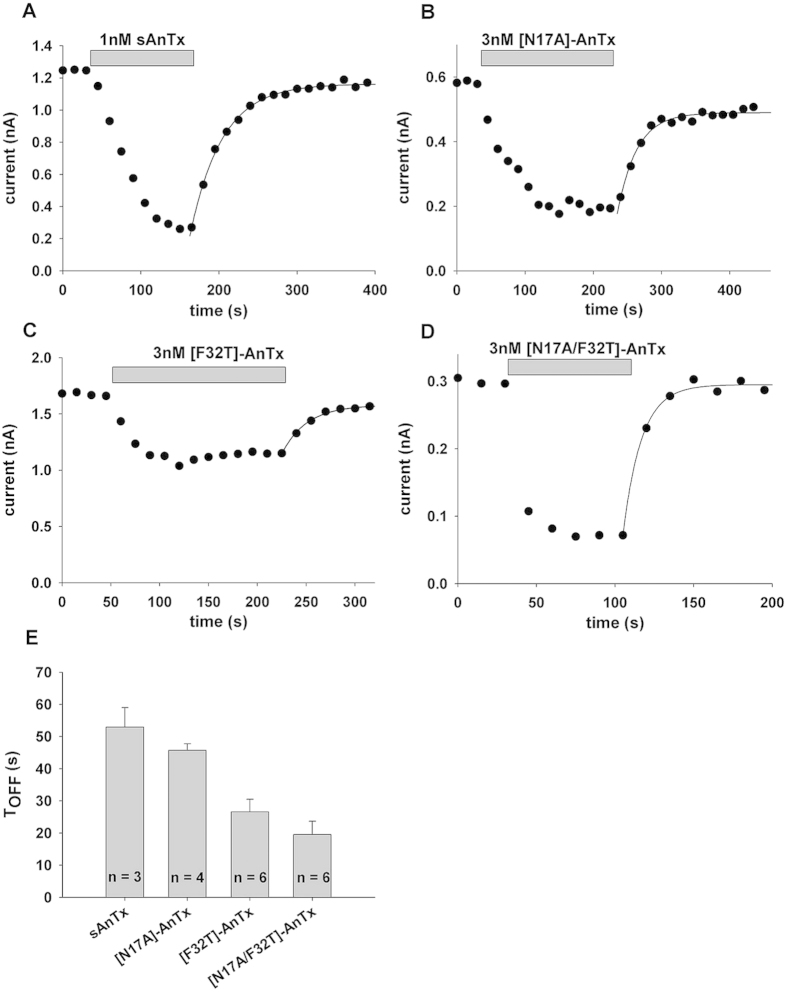
Figure 4. Time course of the development and the elimination of Kv1.3 current block by AnTx variants.
Whole-cell Kv1.3 currents were evoked in human lymphocytes in response to depolarizing pulses to +50 mV from a holding potential of −100 mV every 15 s. Peak K+ currents were determined and plotted as a function of time. Grey bars mark the presence of an AnTx variant at the indicated concentration in the bath solution for sAnTx (1 nM, panel A,), [N17A]-AnTx (3 nM, panel B), [F32T]-AnTx (3 nM, panel C) and [N17A/F32T]-AnTx (3 nM, panel D). Superimposed solid lines indicate the best fit single exponential function to the data points obtained during the wash-out of the toxins: A(t) = B × (1 − exp(−t/TOFF)) + C, where B = A(t = ∞) − C, A(t) is the amplitude of the measured current at time t, C is the peak current at equilibrium block and TOFF is the time constant for the elimination of the block upon perfusion of the bath with toxin-free solution. (E) Bars indicate the average TOFF (±SEM) for the AnTx variants calculated from the indicated (n = 4–7) number of independent fits.

