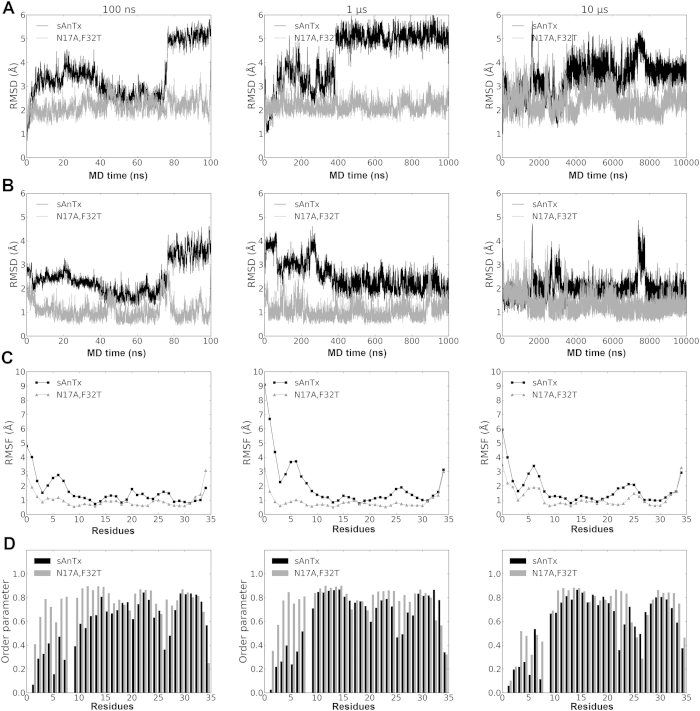
Figure 7. Comparison of sAnTx and [N17A/F32T]-AnTx in the three MD simulations of 100 ns, 1 μs and 10 μs lengths.
Data are presented for sAnTx (black line) and for [N17A/F32T]-AnTx (grey line). The RMSD of structures calculated on the backbone atoms with respect to the (A) first and (B) an averaged structure over the trajectories. (C) Fluctuations in the atomic positions and order parameters of the NH bond vectors during the trajectories. The fluctuations were calculated for sAnTx (black line) and [N17A/F32T]-AnTx (grey line) with reference to the starting structure of the simulation. The fluctuations are mass-weighted average of atomic fluctuations of each atom for each residues. (D) Order parameters of the NH bond vectors.

