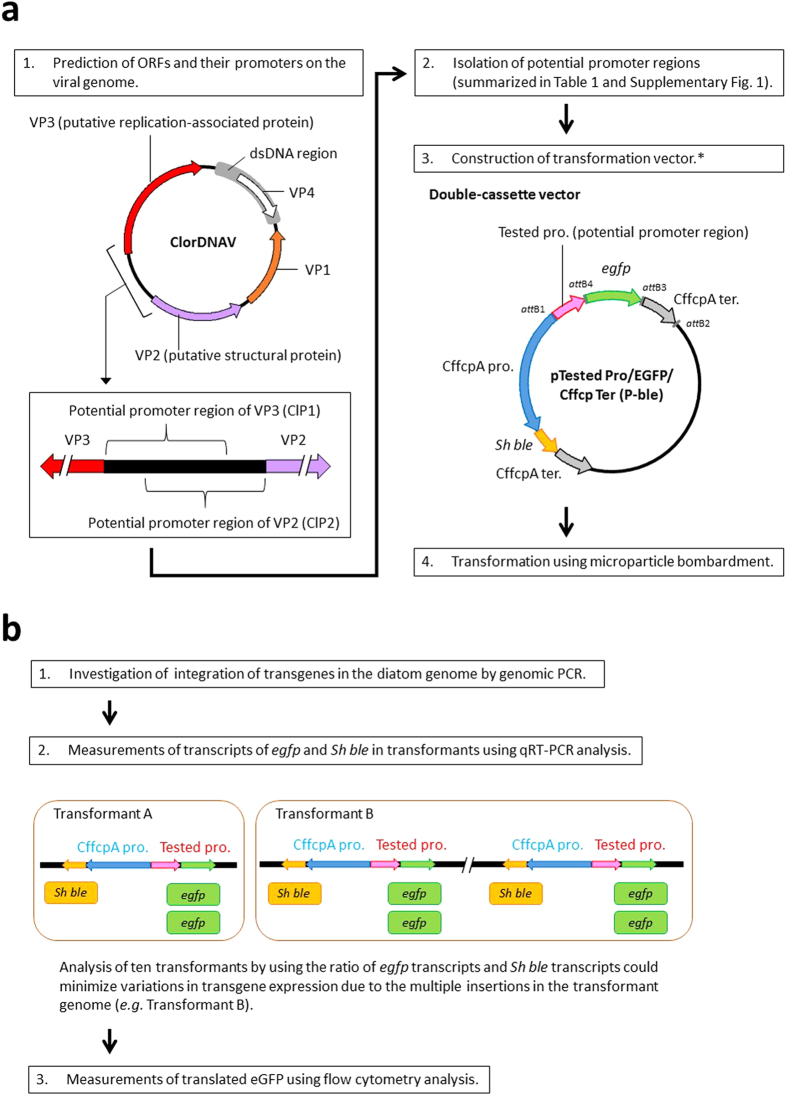
Figure 1. Schematic diagram for the evaluation of promoter activity.
(a) Outline of the construction of transformation vectors and transformations. After predicting putative ORF positions32, upstream regions of the ORFs were determined as potential promoter regions. Potential promoter regions amplified by PCR were used to construct the transformation vectors. The double-cassette vector containing the reporter gene egfp driven by each tested promoter and the antibiotic-resistant gene Sh ble driven by the promoter region of the fucoxanthin chlorophyll a/c-binding protein (FCP) A-1A gene derived from Cyl. fusiformis (termed CffcpA pro.) were constructed. (b) Assessment of promoter activity. Promoter activity was determined by averaging the ratios of egfp mRNA transcript levels to those of Sh ble mRNA transcripts in ten transformants to minimize the effects of copy numbers on the expression of transgenes. These transformants were also used to investigate eGFP protein expression patterns. CffcpA ter.: terminator region of the FCP A-1A gene derived from Cyl. fusiformis. The structure of the ClorDNA genome was modified from Tomaru et al.32. *For the transformation vector of the nitrate reductase gene promoter, we used pNICgfp18 (Supplementary Fig. 5a).

