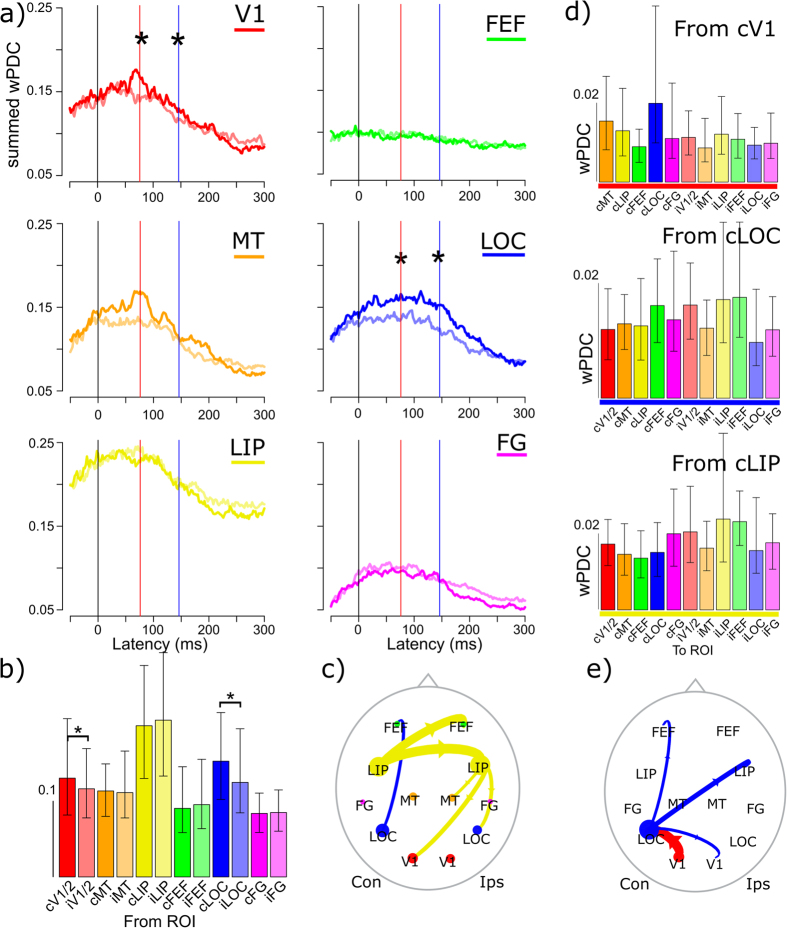
Figure 5.
(a) Dynamics of summed driving (wPDC) from each ROI in the alpha band, for stimuli in the contralateral and ipsilateral (semi-transparent colors) visual field. Identical color-coding is used for the barplots; significant differences are indicated with an asterisk, see Methods. (b) Shows the summed driving at the N1 peak latency for each ROI. Panel (c) illustrates the 5% strongest connections at this latency. (d) Shows the driving from cV1, cLOC and cLIP to the other ROIs. (e) summarizes the directed connectivity from stimulus selective ROIs at the C1 peak latency. Plotting conventions are the same as those in Fig. 4.

