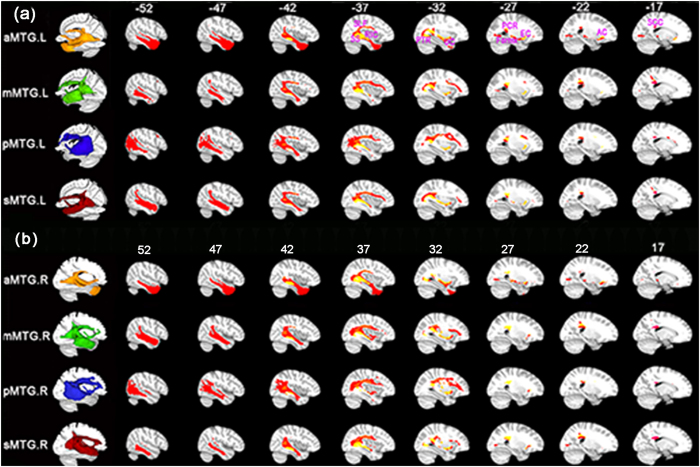
Figure 2. Population maps of the probabilistic tractography patterns.
(a) for the left aMTG, mMTG, pMTG, and sMTG subregion, and (b) for the right MTGs. The fibers in the first column are shown on the ICBM152 template in the MNI space with Mango (http://www.brainmap.org) and multi-slice views are shown with MRIcron. To obtain the population maps, we first performed the whole brain probabilistic fiber tracking seeded in the aMTG, mMTG, pMTG, and sMTG. Second, we calculated the connection probability and thresholded it at p > 0.04% at individual level. Third, the fiber connections of each subject were binarized and warped into standard MNI space. Forth, we obtained a population map by averaging the binarized maps across all the 18 subjects. Fifth, we set a threshold at 50% in the population map to identify the main white matter pathway of each MTG subregion. Finally, we used JHU white matter tractography atlas to label the main fiber pathways. According to the JHU atlas, the main fiber tracts are illustrated and marked in yellow to orange, including the superior longitudinal fasciculus (SLF), sagittal stratum (SS), posterior thalamic radiation (PTR), external capsule (EC), posterior corona radiata (PCR), fornix (Fornix), anterior corona radiata (ACR), splenium of corpus callosum (SCC), retrolenticular part of internal capsule (RIC), uncinate fasciculus (UF).

