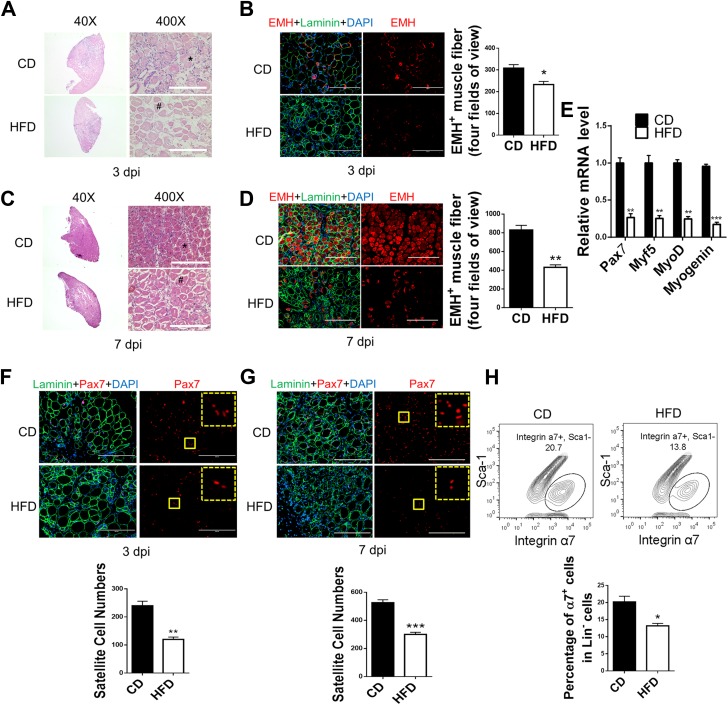
Figure 2.
Attenuated muscle regeneration in mice with diet-induced obesity. TA muscle of mice fed a control diet (CD) and a high-fat diet (HFD) were injured by CTX injection. A: Regeneration of TA muscle at 3 days postinjury (dpi) examined by H-E staining showing necrotic muscle fibers (#) and regenerating muscle fibers (*). B: IHC staining of EMH+ muscle fibers in TA muscle at 3 dpi and quantification. C: Regeneration of TA muscle at 7 dpi examined by H-E staining showing necrotic muscle fibers (#) and regenerating muscle fibers (*). D: IHC staining of EMH+ muscle fibers in TA muscle at 7 dpi and quantification. E: Pax7, Myf5, MyoD, and myogenin mRNA levels in TA muscle at 3 dpi. F and G: IHC staining of Pax7+ satellite cells in TA muscle at 3 dpi (F) and 7 dpi (G) and quantification. The dotted-line inset on each image shows magnification of the area marked by the solid-line box. H: FACS for Lin−/Sca-1−/integrin α7+ satellite cells in TA muscle at 7 dpi. Data are mean ± SEM (n = 3). Scale bars = 200 μm. *P < 0.05, **P < 0.01, ***P < 0.0001 vs. control.

