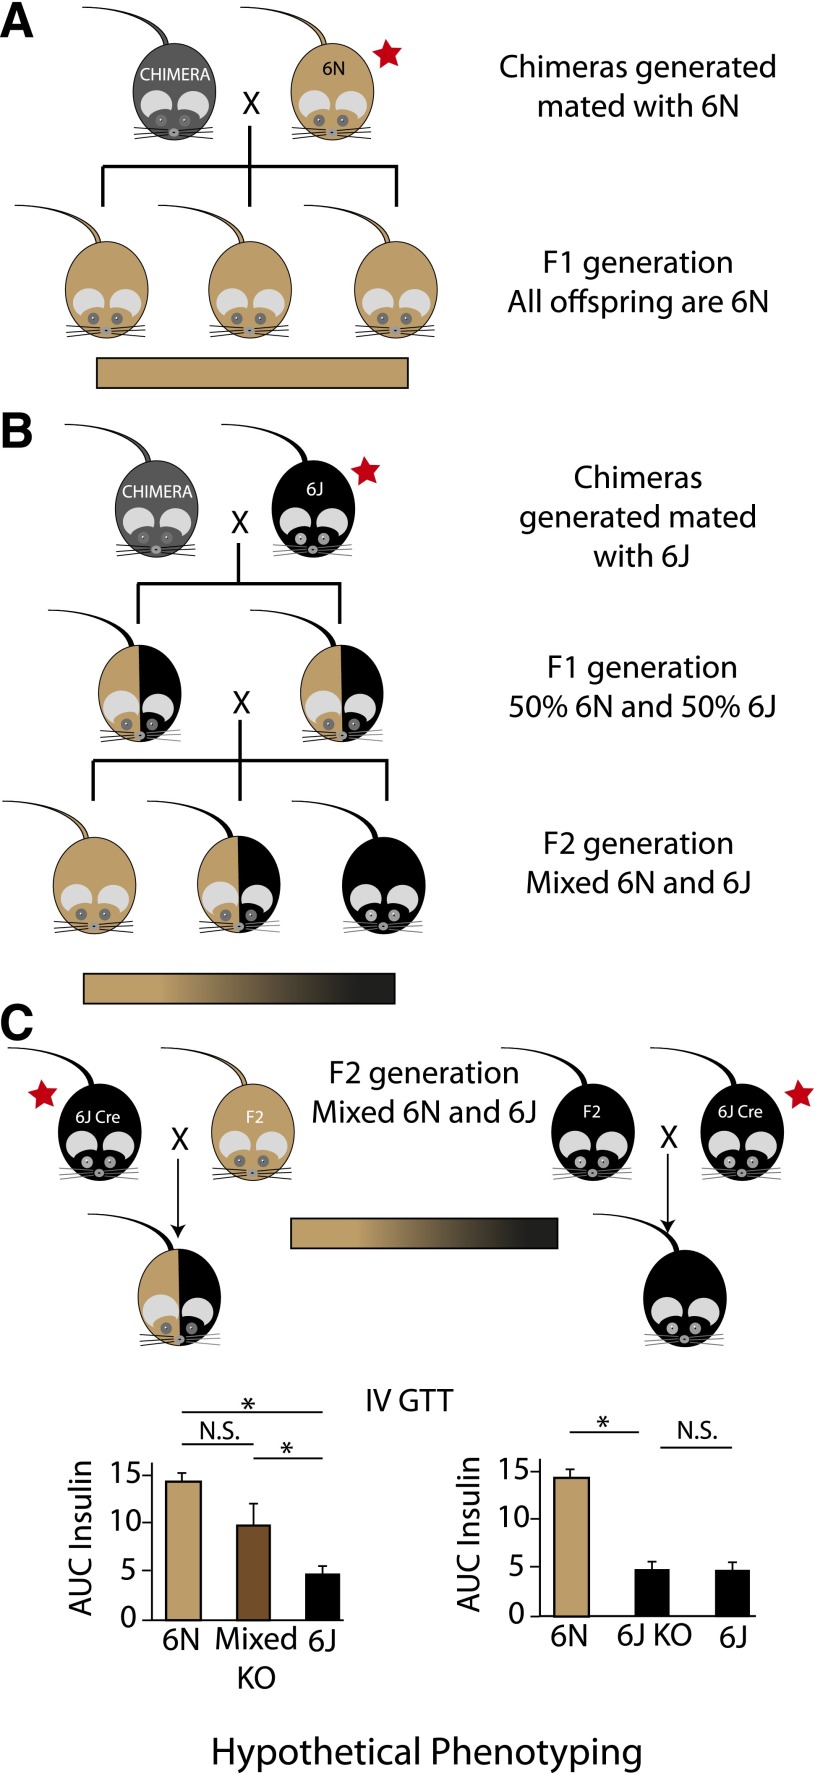
Figure 2.
Results of differing breeding strategies using 6N ES cells from IKMC to generate knockout mice. A: 6N ES cells are microinjected into a nonisogenic blastocyst and implanted into a female surrogate. The resulting chimeras (represented as gray) are then mated with a 6N mouse (represented as light brown) to generate isogenic 6N offspring with germline transmission of the targeted allele. B: In this example, the chimeras generated with 6N ES cells are instead mated to a 6J (represented as black), giving rise to an F1 generation with germline transmission on a mixed background that is 50% 6J and 50% 6N (heterozygous at all alleles that differ between these two substrains). If sibling or nonlittermate pairs from the F1 generation are mated together, the F2 generation is a mixed 6J/6N background, with some animals inheriting primarily 6J alleles and others inheriting predominantly 6N alleles. The large variability in the background of this generation is depicted as a gradient bar. C: This schematic shows some of the problems that can arise with mixed backgrounds and breeding with nonisogenic recombinase strains (Cre) to produce knockout (KO) animals. Littermates selected from the F2 generation in B for breeding represent the extremes of the genetic variation in this generation, with predominantly 6N or 6J alleles. If these F2 littermates are selected as mating partners with a Cre mouse on the 6J background, the offspring from each mating pair will have very different genetic backgrounds. The predominantly 6N mouse will produce pups that are on a highly heterozygous background for 6N/6J alleles (left scenario). However, the predominantly 6J mouse will produce offspring with nearly 100% homozygosity for 6J alleles (right scenario). When phenotyping for a metabolic trait that differs between the 6N and 6J background strains, the analysis can be confounded. We provide representative graphs of hypothetical area under the curve (AUC) insulin data during an intravenous (IV) GTT. An asterisk indicates a statistically significant difference. The magnitude of difference between the 6N and 6J strains is based on actual data (35). Differing conclusions can be drawn depending on what control group is used. The red stars indicate breeding steps where use of the correct substrain is critical to avoid mixed backgrounds. Of note, the colors selected for representation are not intended to depict the predicted coat colors of these mice. N.S., not significant.

