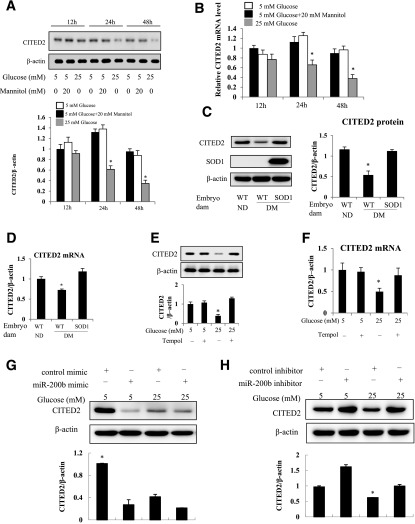
Figure 4.
High glucose downregulates CITED2 expression through miR-200b. Changes in CITED2 protein expression (A) and mRNA expression (B) in cells cultured under 5 mmol/L glucose, 5 mmol/L glucose plus 20 mmol/L mannitol (the osmotic control of glucose), or 25 mmol/L glucose conditions for 12, 24, and 48 h. Experiments were repeated three times (n = 3), and the quantification of data is shown in the bar graphs. *Significant differences (P < 0.05) compared with the 5 mmol/L glucose group and the 5 mmol/L glucose plus 20 mmol/L mannitol group. Levels of CITED2 protein (C) and mRNA (D) in WT embryos from nondiabetic (ND) dams and WT and SOD1-overexpressing embryos from diabetic (DM) dams mated with SOD1-Tg males. Experiments were repeated three times using embryos from three different dams (n = 3) per group, and the quantification of the data is shown in the bar graphs. CITED2 protein levels (E) and mRNA levels (F) in cells cultured under 5 mmol/L glucose or 25 mmol/L glucose conditions in the absence or presence of tempol (100 μmol/L). The quantification of data is shown in the bar graphs. G: Levels of CITED2 protein in cells transfected with the control oligo or the miR-200b mimic under 5 mmol/L or 25 mmol/L glucose conditions. H: Levels of CITED2 protein expression in cells transfected with the control oligo or the miR-200b inhibitor under 5 mmol/L or 25 mmol/L glucose conditions. In E–H, experiments were repeated three times (n = 3). *Significant differences (P < 0.05) compared with the other three groups.

