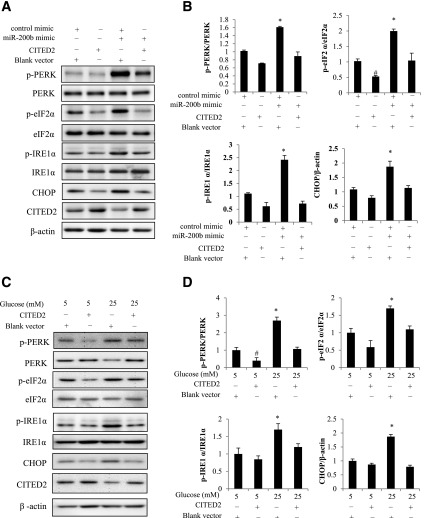
Figure 7.
Restoring CITED2 expression blocks miR-200b– or high glucose–induced ER stress. A and B: Protein levels of ER stress markers p-PERK, PERK, p-eIF2α, eIF2α, p-IRE1α, IRE1α, and CHOP in cells transfected with the CITED2 plasmid and cotransfected with the control oligo or the miR-200b mimic. C and D: Protein levels of ER stress markers p-PERK, PERK, p-eIF2α, eIF2α, p-IRE1α, IRE1α, and CHOP in cells transfected with the blank vector or the CITED2 plasmid and then treated with 5 mmol/L glucose or 25 mmol/L glucose. Experiments were repeated three times (n = 3), and the quantification of data is shown in the bar graphs. * and # indicate significant differences (P < 0.05) compared with the other three groups.

