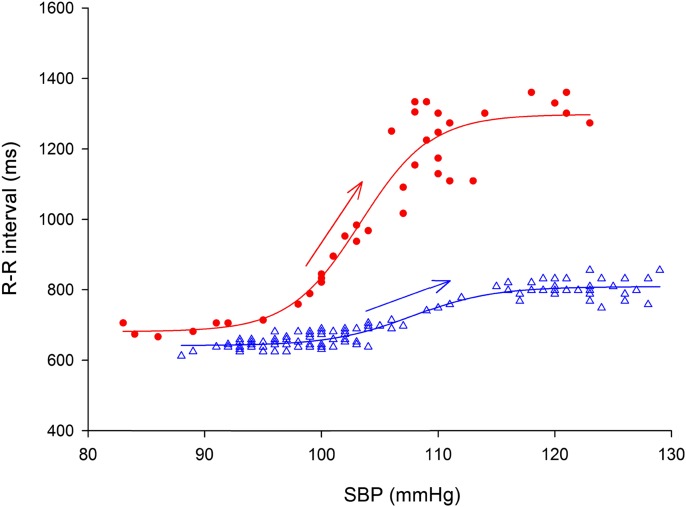
Figure 2.
Baroreflex function from a representative subject measured by the modified Oxford method during baseline euglycemia (circles) and hypoglycemia (triangles). Data points represent the corresponding values of SBP and cardiac interval (R-R) during the pharmacologically induced blood pressure change. For baroreflex assessment, R-R is plotted as a function of SBP between the lowest and the highest SBP values. The linear portion (arrows) of the sigmoid function describes BRS (see research design and methods). During hypoglycemia, BRS is decreased, maximal R-R interval is decreased, and the sigmoidal baroreflex function curve shifts to the right.

