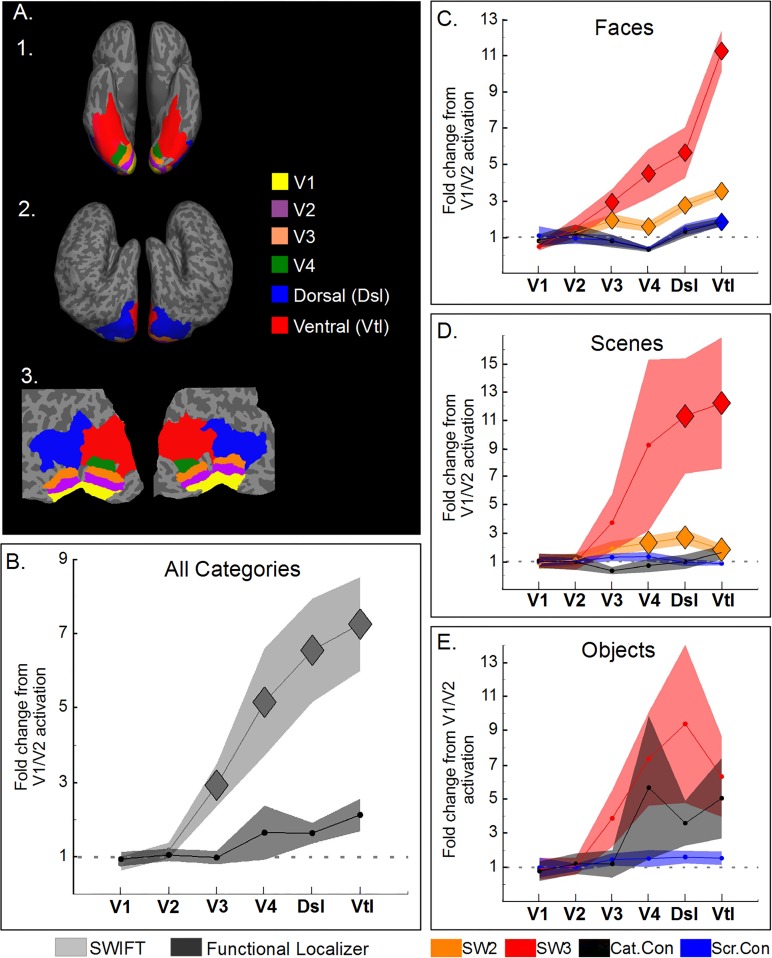
Fig 5. SWIFT increasingly activates areas along the visual pathway.
(A) Cortical surface of a representative participant showing ROIs used in the analysis (see Materials and Methods). A1 Ventral view. A2. Lateral view. A3. Flattened occipital pole view. (B-E) Normalized proportion of activated voxels (as the fold change respective to V1/V2 activations, threshold at p<0.001) across different cortical areas hierarchically sorted: V1, V2, V3, V4, dorsal (Dsl) and ventral areas (Vtl). (B) Normalized proportion of activated voxels for all categories and experiments averaged, separately for SWIFT and the localizer. (C, D and E) for faces, scenes and objects, respectively. The proportion increases along the pathway in SWIFT 2 and 3 (orange and red) while it is uniform for the localizer with category- and scramble-contrast (black and blue). Shaded areas correspond to SEM across participants. Diamonds represent proportions significantly different from 1 (corrected at FDR q = 0.05).

