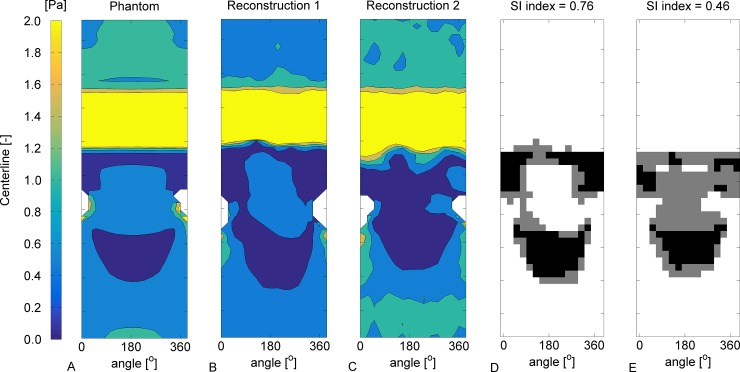
Fig 5. Analysis of SI of WSS in phantom 1 and the corresponding reconstructions.
A: Contour plot of the WSS. Similar as Fig 4 a low WSS region is located directly distal of the stenosis and distal of the side branch. B: Contour plot of the WSS in the reconstruction based on the segmentation from reader 1. C: Contour plot in reconstruction 2. D: Plot of the SI between the phantom and reconstruction 1. The white indicates WSS above 0.5 Pa in both the phantom and the reconstruction. Gray indicates low WSS in either the phantom or the reconstruction. Black indicates low WSS in both the phantom and the reconstruction. E: SI between the phantom and reconstruction 2.

