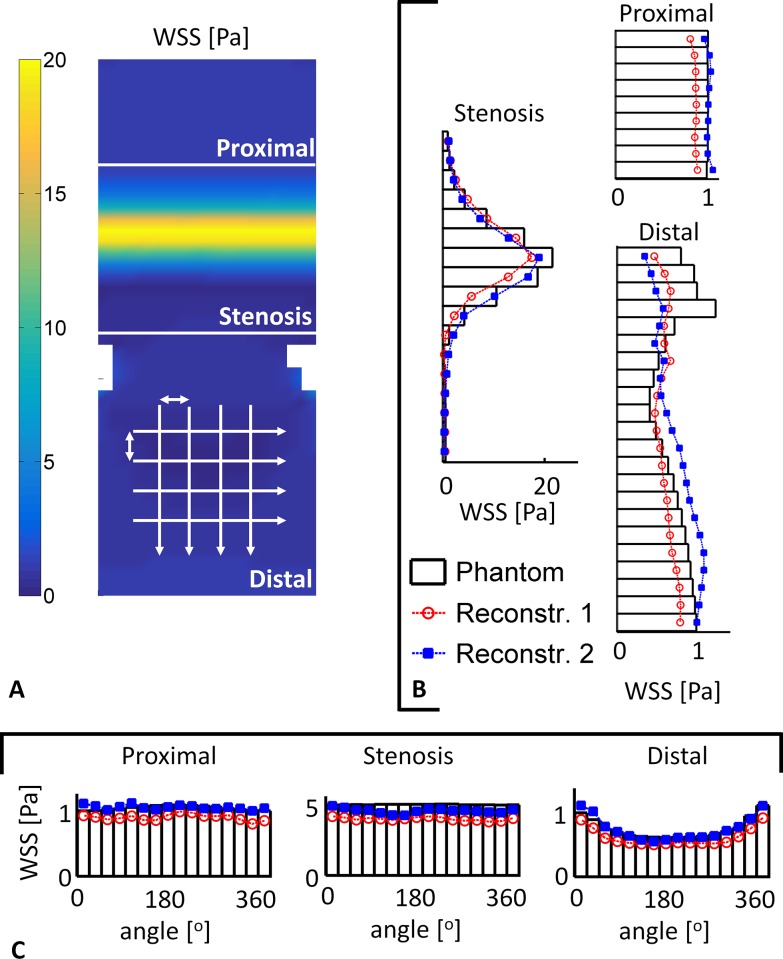
Fig 6. Quantitative analysis of the WSS in phantom 1.
The white lines mark the three regions. A: 2D WSS map of phantom 1.The arrows indicate the direction of the averaging procedure. B: The circumferential means in the three regions. The bars indicate the mean circumferential WSS in the phantom and the lines the WSS from reconstruction 1 (red circle) and reconstruction 2 (blue square). In the proximal and stenosis region the WSS from the readers match the WSS in the phantom. In the distal region more pronounced differences are observed, primarily directly after the stenosis. C: Axial means in the three regions. In all regions the WSS from the readers match the WSS in the phantom.

