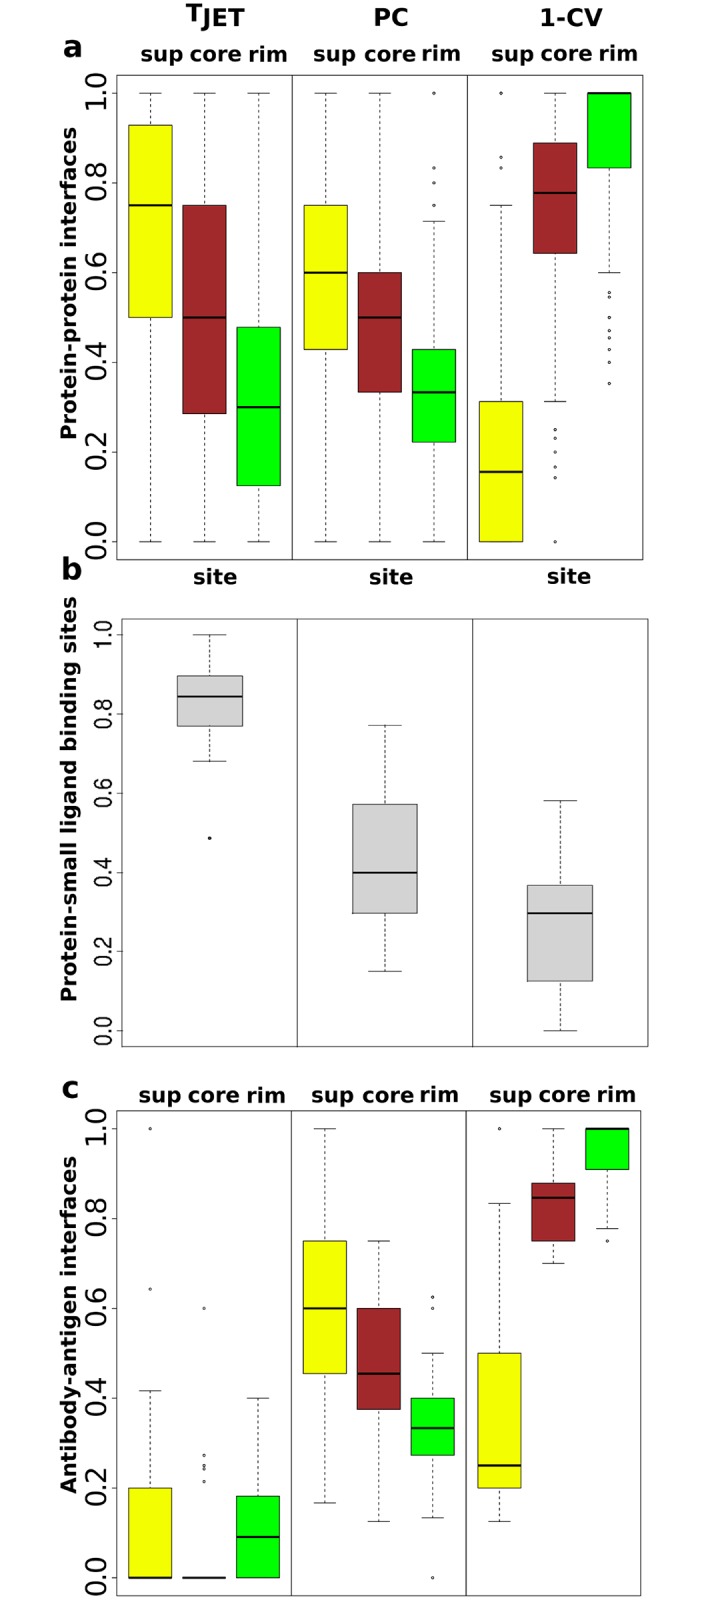
Fig 1. Signals detected in experimental interfaces.

The boxplots represent the distributions of the proportions of interacting residues having values above the median value computed over the entire protein. TJET: conservation level, PC: interface propensity, CV: circular variance. Distributions are computed from PPDBv4 on: (a) all protein-protein interfaces, (b) all protein-small ligand binding sites, (c) protein-protein interfaces for antibodies. For protein-protein interfaces, the support, core and rim are in yellow, brown and green respectively.
