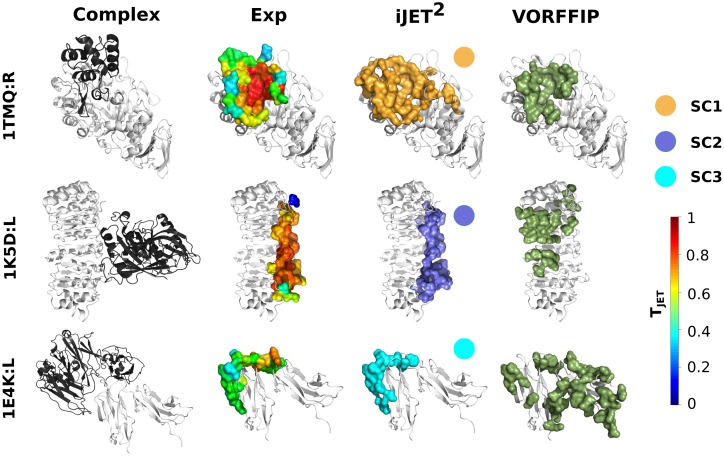
Fig 3. Examples of interaction sites predicted by the three scoring schemes.
The experimental complexes formed between the proteins of interest (light grey) and their partners (dark grey) are represented as cartoons. The experimental and predicted binding sites are displayed as opaque surfaces. The experimental interface residues are colored according to TJET values computed by iJET2. iJET2 predictions were obtained from a consensus of 2 runs out of 10. They are colored according to the scoring scheme from which they were obtained: SC1 in orange, SC2 in purple and SC3 in cyan. The scoring schemes are indicated for each protein. They were automatically chosen by iJET2 clustering algorithm (first round). VORFFIP predictions are colored in dark green.

