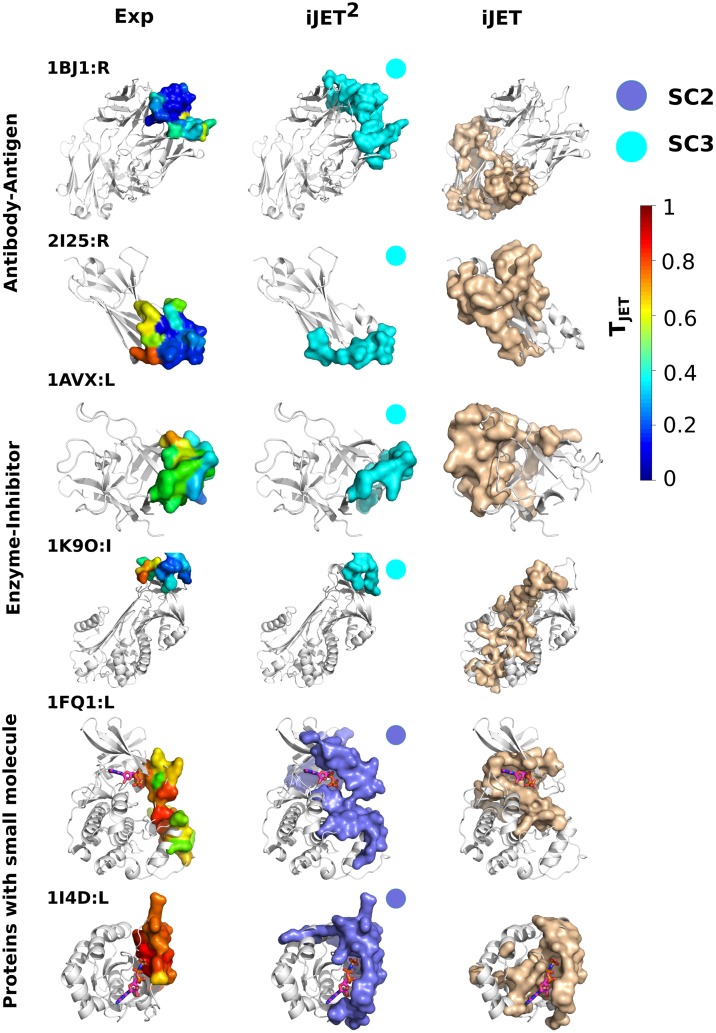
Fig 5. Single-patch interaction sites of groups of proteins known to be difficult to predict.
The predicted and experimental binding sites are displayed as colored opaque surfaces. The experimental binding sites are colored according to TJET computed by iJET2. iJET2 predictions were obtained from a consensus of 2 runs out of 10. They are colored according to the scoring scheme from which they were obtained: SC2 in purple and SC3 in cyan. The scoring schemes are indicated for each protein. A comparison with iJET predictions (right) is shown.

