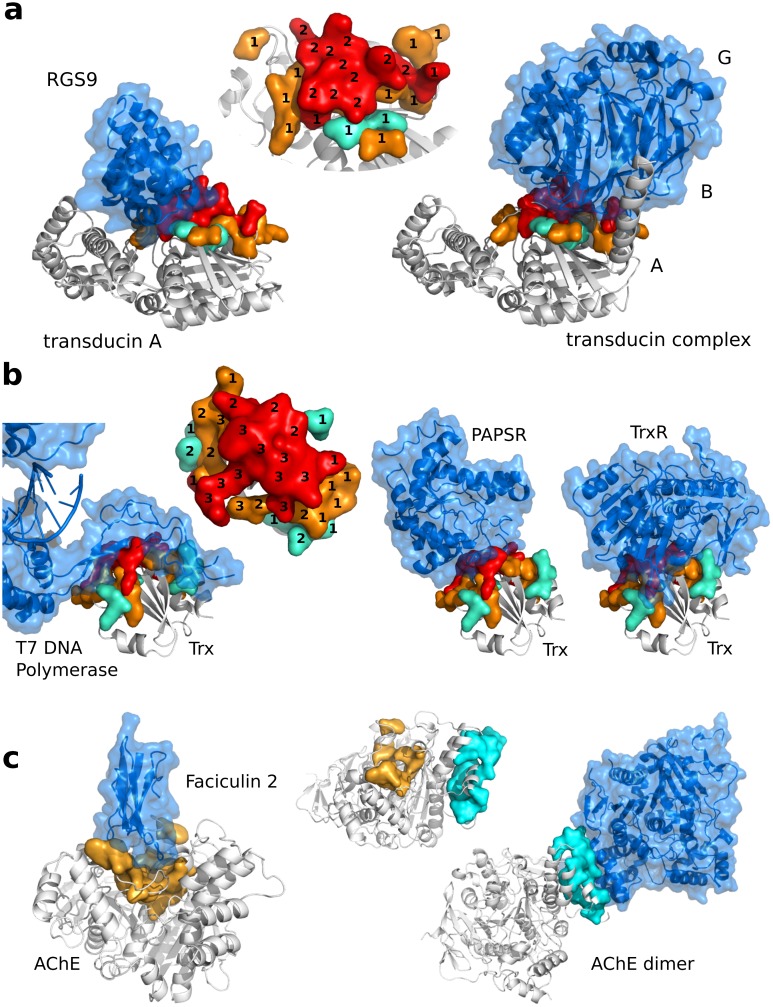
Fig 7. JET2 predictions of protein interfaces with different partners.
The protein of interest is represented as a grey cartoon while its partners are displayed as blue cartoons and transparent surfaces. (a-b) Moonlighting proteins, interacting with different partners via the same surface region. Residues (true positives) predicted by JET2 (SC2) are displayed as a colored opaque surface: cluster seed, extension and outer layer are in red, orange and cyan. On the predicted patches are indicated, for each residue, the number of interactions it is involved in. (a) Complexes of transducin Gα subunit with RGS9 (on the left, PDB code: 1FQJ) and with transducin Gβγ (on the right, PDB code: 1GOT). (b) Complexes of thioredoxin (Trx) with T7 DNA polymerase (on the left, PDB code: 1X9M), with PAPS reductase (in the middle, PDB code: 2O8V) and with Trx reductase (on the right, PDB code: 1F6M). (c) Protein which partners bind to two different locations. iJET2 predicted patches are colored according the scoring scheme used: SC1 in orange and SC3 in cyan.

