
Figure 1. Microbiota differences between groups who were hospitalized or not.
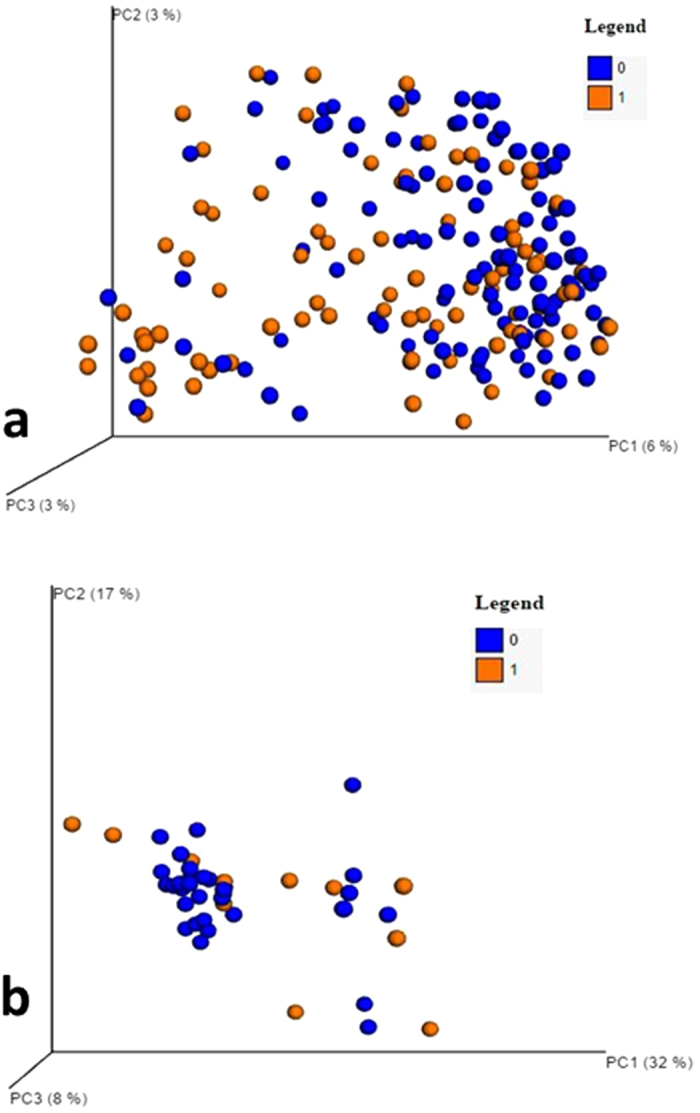
(A,B) Principal component analysis (PCO) showed a relative clustering of cirrhotics who were not hospitalized (blue dots, coded 0) compared to others (orange dots, coded 1). (A) Stool PCO plots with/without hospitalization. (B) Sigmoid mucosa PCO plots with/without hospitalization.