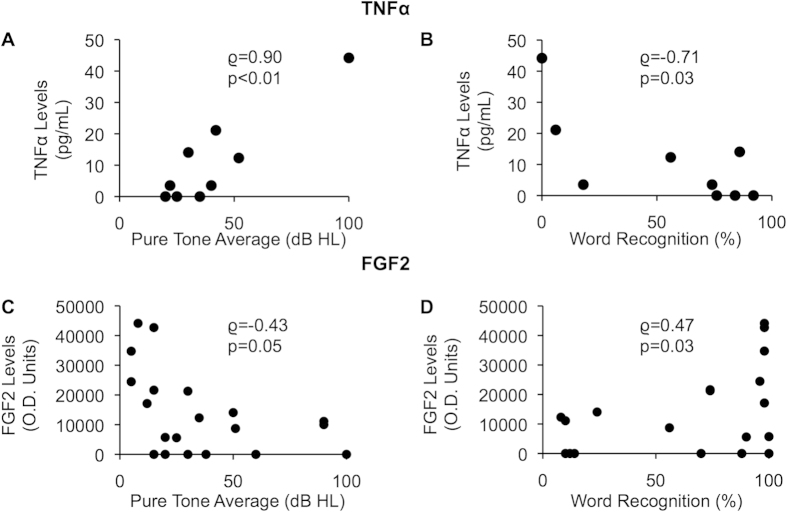
Figure 3. Correlation of VS-secreted TNFα and FGF2 with SNHL due to VS.
(A). Correlation of pure tone average (dB) and (B). word recognition score (%) of ipsilateral ear to the VS, and measured secreted TNFα levels from VSs (n = 9). (C). Correlation of pure tone average (dB) and (D). word recognition score (%) of ipsilateral ear to the VS and measured secreted FGF2 levels from VSs (n = 21). p-values are shown, rho represents Spearman’s rank correlation coefficient.

