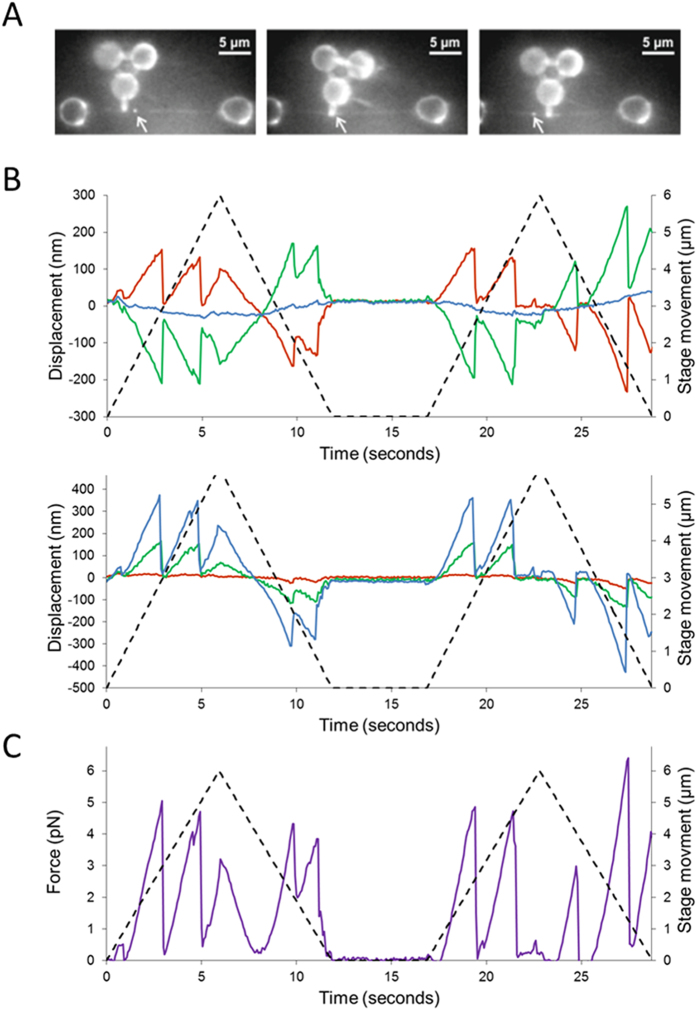
Figure 3. Nanoprobe detection of UvrA2 on DNA.
(A) OAF images of the nanoprobe interacting with a YOYO-1 stained DNA tightrope. The bright spot on the DNA, indicated with an arrow, is a Qdot-labeled UvrA2. (B) Measurements were made using the APS to generate a displacement trace of the nanoprobe in x (upper panel) and y (lower panel). The red, blue and green lines represent the three vertices as indicated in (Fig. 2B), and the dashed line shows the movement of the stage during each sweep over 6 μm at a rate of 1 μm/sec. (C) The displacements were used to calculate the force acting on the bound UvrA2 (see supplementary Figure 3). As the nanoprobe sweeps across the protein the resistance increases up to a yield force as the nanoprobe slips past the protein. As the probe performs a return sweep, interactions can be seen in the same location as the forward sweep. This indicates the protein has not detached or moved following the first encounter with the nanoprobe. Further confirmation of this is provided in supplementary Figure 4.

