
Figure 3. Three structures (panels a,b,c) representative of the ensemble of conformations in state S2, featuring the new cavity at the interface.
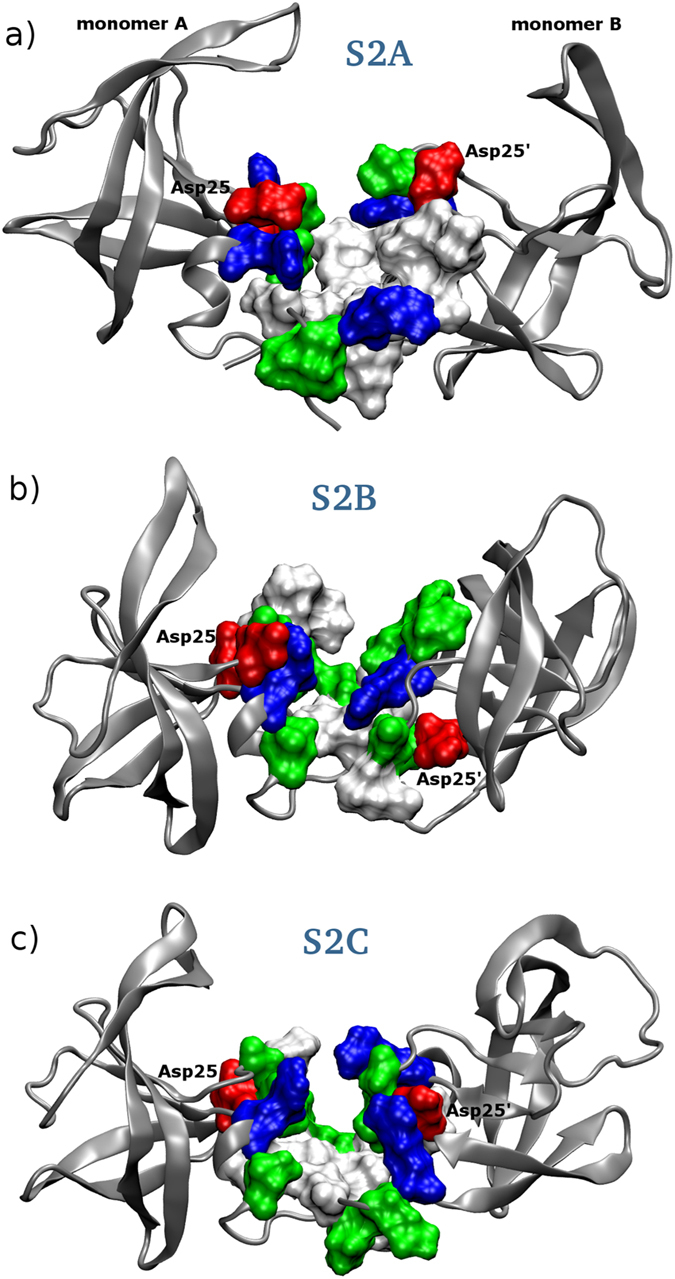
The monomers A and B composing HIV1 protease are indicated as well as the two Asp from the catalytic triad. Hydrophobic residues are shown in white color, positively charged in blue, negatively charged in red and polar residues in green color. See text for details.