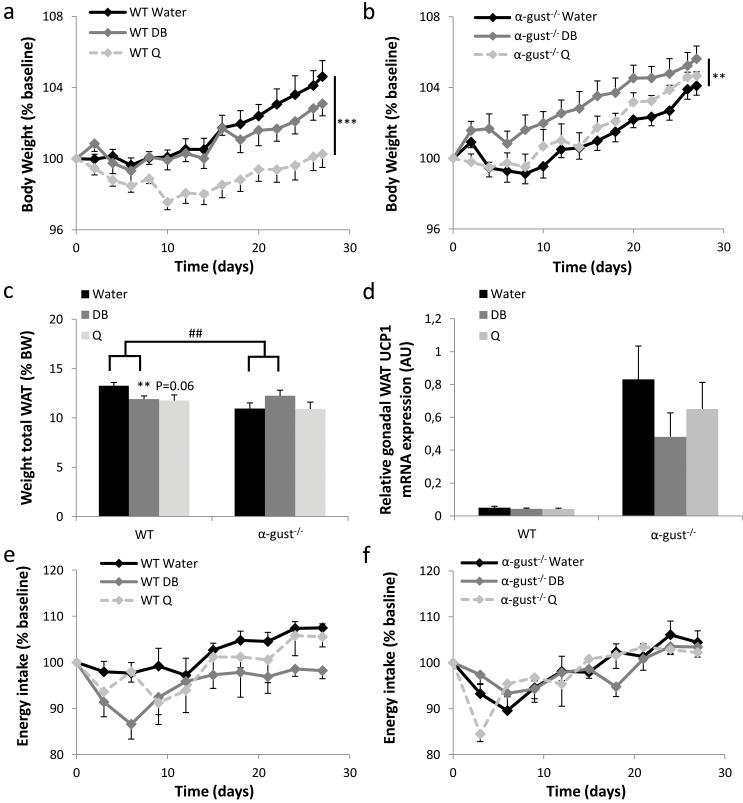
Fig 3. Comparison of the energy balance during treatment with bitter agonists of obese WT and α-gust-/- mice.
(a-b) Changes in body weight during daily intra-gastric administration of water, DB (60 μmol/kg) or Q (160 μmol/kg) for 4 weeks in high-fat diet (15 weeks) obese (a) WT (n = 9–12) and (b) α-gust-/- mice (n = 8–12). Results are expressed as percentage change from baseline, defined as the mean body weight measured during one week before the treatment. (c) Combined weight of gonadal, subcutaneous and mesenteric fat pads as percentage of total body weight of control or bitter treated WT (n = 9–12) and α-gust-/- mice (n = 9–12), at sacrifice. (d) Relative mRNA expression of UCP1 in gonadal WAT of control or bitter treated WT (n = 7–9) and α-gust-/- (n = 7–8) mice. (e-f) Changes in energy intake during the 4-week treatment period in (e) WT (n = 6–8) and (f) α-gust-/- mice (n = 7–8), expressed as percentage change from baseline, defined as the mean energy intake measured during 9 days before the treatment. **: P<0.01; ***: P<0.001 water vs bitter; ##: P<0.01 treatment (water vs DB) x genotype.

