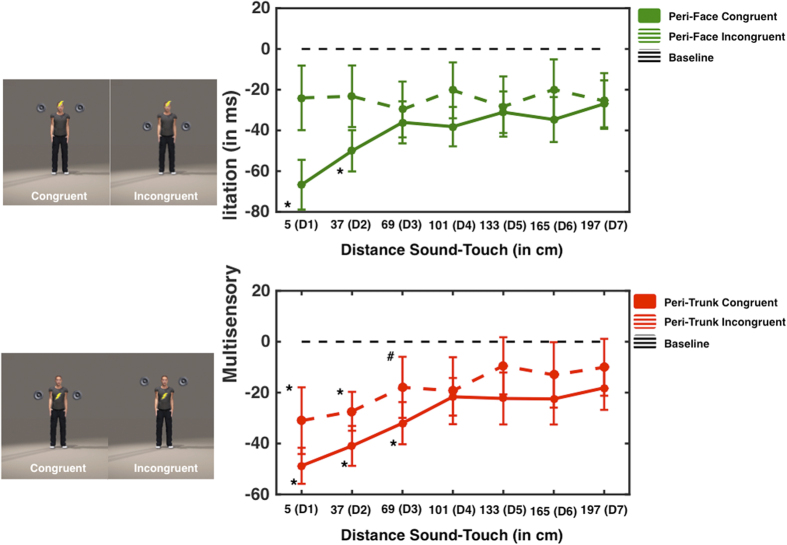
Figure 5. Peri-Face and Peri-Trunk comparison-Experiment 6.
Left upper panel: Participants received a tactile stimulation on their forehead (to study the peri-face space), while sounds (depicted by the couple of loudspeakers) approached their face (congruent audio-tactile stimulation) or their trunk (incongruent audio-tactile stimulation). Right upper panel: Multisensory facilitation (in ms; negative values indicate multimodal audio-tactile RT <unimodal baseline tactile trials) as a function of sound distance at the moment of tactile stimulation (D1 indicates the smallest distance, while D6 indicates the largest distance) and congruency condition of audio-tactile stimulation (solid line represents the congruent condition, and dashed line the incongruent condition). The black dashed horizontal line indicates baseline, i.e., RT to the fastest unimodal tactile stimulation, and * indicate a significant facilitation effect with respect to baseline (p < 0.05, Bonferroni-corrected). Error bars indicate +/−1 S.E.M. Left lower panel: Participants received a tactile stimulation on their chest (to study the peri-trunk space), while sounds approached their trunk (congruent audio-tactile stimulation) or their face (incongruent audio-tactile stimulation). Right lower panel: Multisensory facilitation (in ms; negative values indicate multimodal audio-tactile RT <unimodal baseline tactile trials) as a function of sound distance at the moment of tactile stimulation (D1 indicates the smallest distance, while D6 indicates the largest distance) and congruency condition of audio-tactile stimulation (solid line represents the congruent condition, and dashed line the incongruent condition). The black dashed horizontal line indicates baseline (RT to tactile stimulation), *represent a significant difference between multimodal and unimodal conditions at a particular sound-touch distance (p < 0.05, Bonferroni-corrected), # represents a significant multisensory facilitation (p < 0.05) that did not survive correction for multiple comparison, and error bars indicate +/−1 S.E.M. (The human figure was created by JNP, using ‘Poser 10′ software (http://my.smithmicro.com/poser-3d-animation-software.html)).

