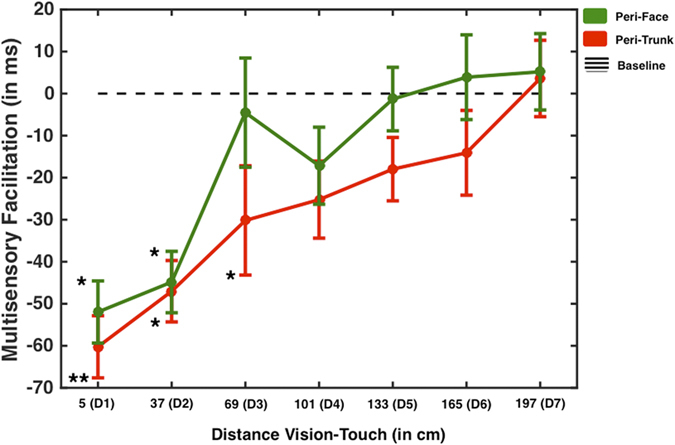
Figure 6. Visuo-Tactile Peri-Face and Peri-Trunk representation – Experiment 7.

Mean RT difference between multisensory (visuo-tactile) and unisensory (tactile) trials as a function of the distance where a virtual ball was presented at the time of tacile stimulation. Green solid line shows the RT profile when touch was administer to the face (to study the peri-face space), while the red solid line shows the RT profile for when tactile stimulation was given on the chest (to study the peri-trunk space). The black dashed horizontal line indicates baseline (RT to tactile stimulation), * and ** represent a significant difference between multimodal and unimodal conditions at a particular sound-touch distance (respectively, p < 0.05 and p < 0.01, Bonferroni-corrected), and error bars indicate +/−1 S.E.M.
