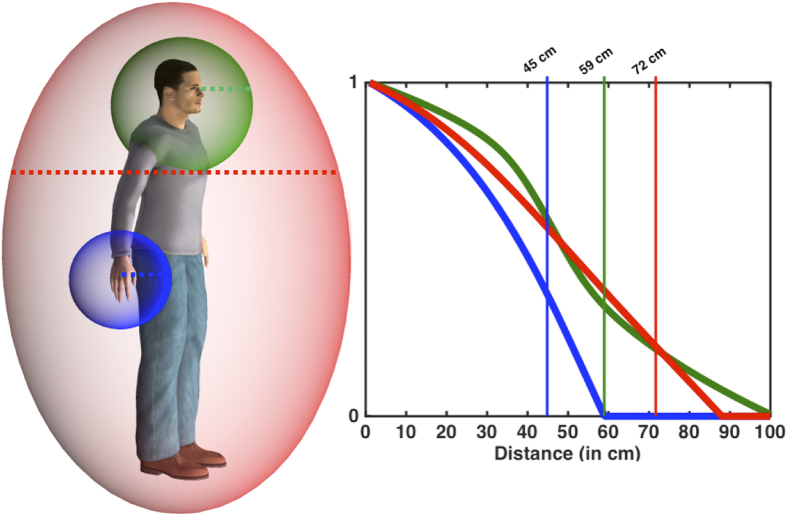
Figure 7. Left panel: Schematic representation of the relative size of peri-hand (blue), peri-face (green), and peri-trunk (red) representation (Notice the gradient in the depiction of peri-hand and peri-face representation: data was not collected for the back space for the hand and the face and hence this panel is to be taken simply as a conceptual schema.
Dashed lines represent spatial extensions that were actually probed in this study). Right panel: Estimates were obtained by fitting all data corresponding to a particular body part across studies 1–6 to a sigmoidal curve after adjusting for total space mapped and points sampled. In this manner, regardless of the total amount of space sampled (1 or 2 meters) or the total amount of distances sampled (5, 6, or 7), the central point parameter of the sigmoid function (peri-hand and peri-face) or the intersection between the linear function describing audio-tactile RTs and the lower bound of the 95% confidence interval describing tactile RTs (in the case of the peri-trunk) were extracted as a punctuate estimate of peri-hand (~45 cm), peri-face (~59 cm), and peri-trunk (~72 cm) space. (Figure drawn by JPN; the human was created with Poser 9, SmithMicro Software, lincense: XF90CRD-0001-14YT-QJF0-201X-EBL7).

