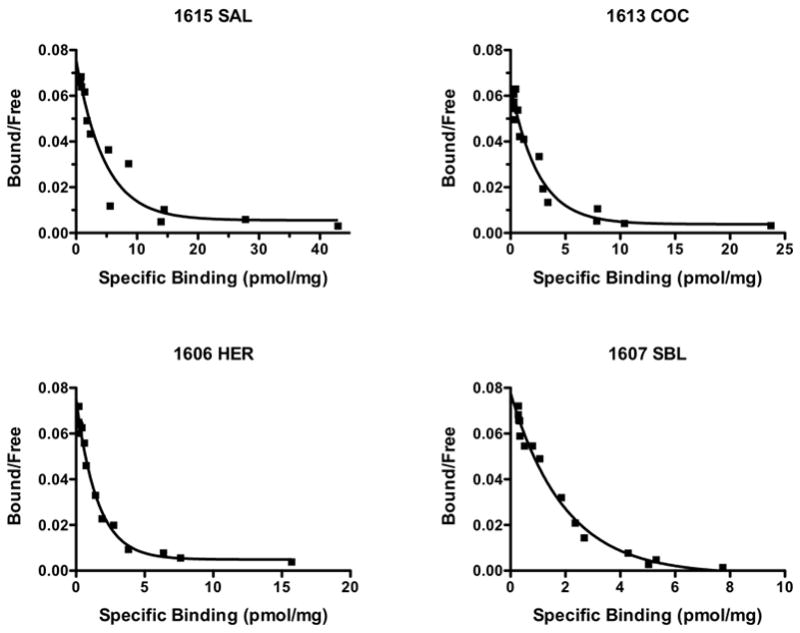
Figure 2. Scatchard plots of saturation RTI-55 binding to NAc membrane preparations from representative subjects in saline (SAL), cocaine (COC), heroin (HER) and speedball (SBL) groups.

Membranes were incubated with 0.1 nM [125I]RTI-55 along with 15 concentrations of unlabeled RTI-55 (0.001–30 nM) in triplicate. Binding data were analyzed by Prism 5 software using a nonlinear curve fit and a two site-specific binding model. Plots display high- and low-affinity binding components.
