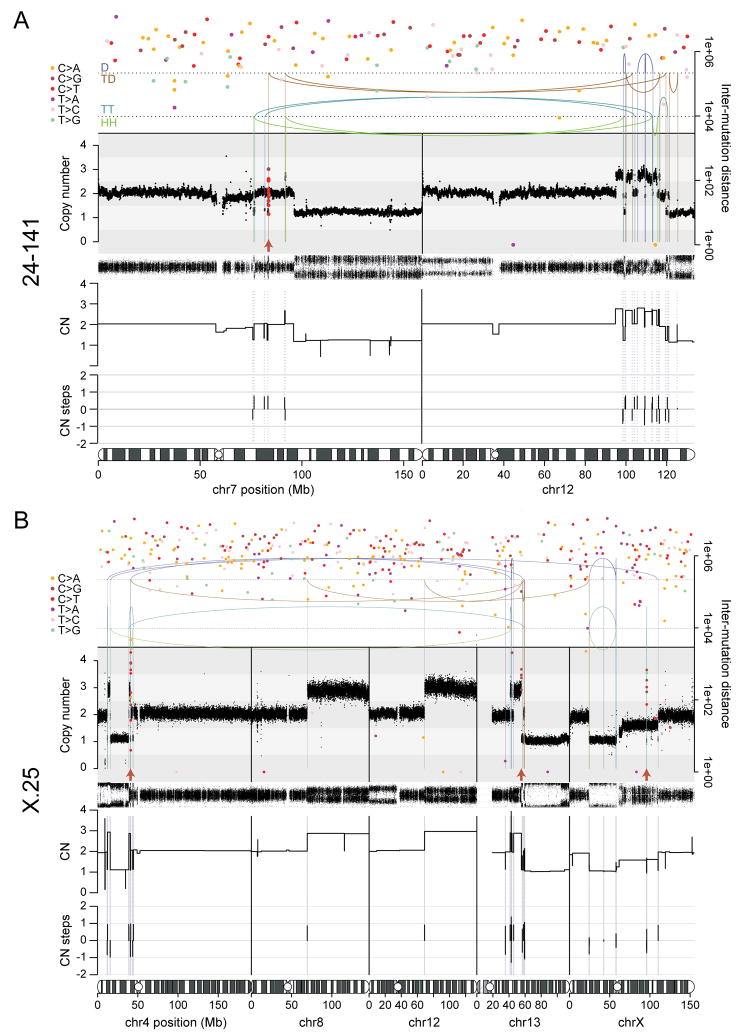
Figure 5. Chromothripsis and kataegis in post-crisis clones 24-141 and X-25.
(A) Chromothripsis and rainfall plot of sample 24-141 involving chromosomes 7 and 12.
(B) Chromothripsis and rainfall plot of sample X-25 involving chromosomes 4, 13 and X. The unbalanced rearrangements involving chromosomes 8 and 12 may have taken place together with the chromothripsis event. In (A) and (B), top: the arcs represent the two ends of rearrangements. Arcs are grouped from top to bottom by the type of rearrangement orientation as follows: deletion (D; +-); tandem duplication (TD; -+); tail-tail (TT; ++); head-head (HH; --). Middle: estimated copy number over genomic windows. The variant allele frequency (VAF) track is shown below the copy number track. Inferred copy number segments are shown below the VAF track. Bottom: amount of copy number change between copy number segments. Chromothripsis after a duplication will yield three copy number states with copy number steps of +1 or -1. Duplication after chromothripsis will yield some copy number steps of +2 or -2. Filled circles: positions of point mutations colored by mutation type. The Y-axis shows the distance of each mutation to the next on the same chromosome, with the respective axis on the right-hand side of the graph. Red arrows: kataegis clusters.

