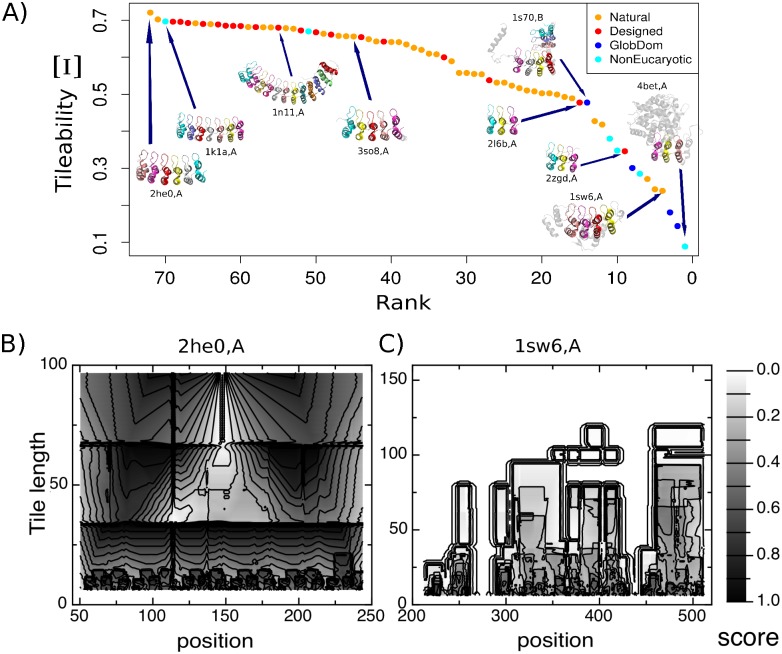
Fig 2. Symmetry of ANK domains.
(A) Tileability values for the ANKs in the dataset. Higher values correspond to more regular structures. Lower values correspond to proteins containing structural perturbations that break the propagation of symmetry at higher length-scales by modifying the spatial arrangement of the repeating units. (B) Per residue tileability for Notch1 (PdbID: 2he0,A), the most symmetric protein in the dataset. (C) Per residue tileability for SWI6 (PdbID: 1sw6,A), one of the least symmetric proteins, due to a high occurrence of structural modifications in the repeats and insertions between them. The x-axis marks the residues in the structure, the y-axis represents the length of the fragments being considered in each case to tesselate the structures. The gray-scale represents the fraction of times in which a residue is part of a fragment that tessellates the protein.

