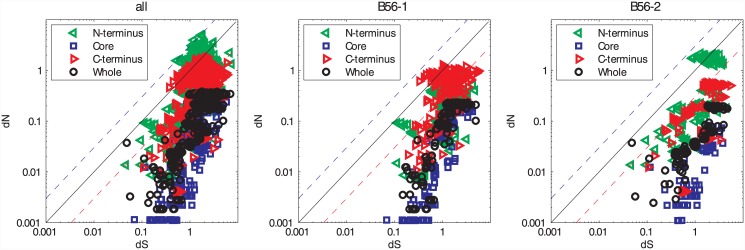
Fig 1. While the B56 Core Experienced Purifying Selection, the N- and C-Termini Experienced Diversifying Selection in Analyses Consisting of Multiple Paralogs.
A log-log plot depicting the dN/dS values for the B56 gene family. “all” included B56α, B56β, B56γ, B56δ, and B56ε; the B56-1 subfamily included B56α, B56β, and B56ε, whereas the B56-2 subfamily included B56γ and B56δ. For each grouping, the values for the N-terminus are depicted by green triangles, the core are represented by blue squares, the C-terminus are depicted by red triangles, and the values for the entire gene are represented by black circles. The black line corresponds to dN/dS = 1 and reflects neutrality. The dashed blue line corresponds to dN/dS = 3 and the dashed red line corresponds to dN/dS = 0.3.

